Cloud Native Monitoring - Basics of VictoriaMetrics
When it comes to cloud native monitoring solutions, the first thing that comes to mind is a mature solution of Prometheus+AlertManager+Grafana. As the core of monitoring, Prometheus has a powerful data model, high-efficiency operation, rich monitoring capabilities, a powerful query language PromQL, Easy to use, easy to manage and so on. But Prometheus is not perfect at the high availability level. To this end, in the open source community, Many alternatives and enhancements have been bred, and VictoriaMetrics is one of the better ones. It is a fast, cost-effective and scalable monitoring solution and time series database.
Seven characteristics
- It can be used as a long-term storage of Prometheus, and supports Prometheus query API, and can be used as a substitute for Prometheus in Grafana;
- Simple deployment, whether it is a single-node version or a cluster version, you only need to run the required component executable files (each component is an executable file), no need to install any dependencies before running, easy to set up and operate;
- Use the vmbackup/vmrestore tool to easily and quickly back up instant snapshots to S3 or GCS;
- Implement MetricsQL based on PromQL query language, and transform PromSQL;
- The read and write performance is as high as 20 times that of InfluxDB and TimescaleDB; the memory usage is 10 times less than that of InfluxDB for millions of time series data. 7x less than Prometheus, Thanos, or Cortex; data is highly compressed, requiring up to 7x less storage than Prometheus, Thanos, or Cortex;
- With high latency IO and low IOPS;
- Supports obtaining data sources from third-party time series databases.
Quick access to Prometheus to obtain data sources
At the data source access level, VictoriaMetrics supports direct compatibility with Prometheus data writing through Prometheus' remote writing method, and also supports the collection of multiple Prometheus data summaries.
remote_write:
   - url: http://<victoriametrics-addr>:8428/api/v1/write

# For multiple proemtheus, you need to configure the identifier of each Prometheus
global:
   external_labels:
     datacenter: dc-123
VictoriaMetrics also supports directly replacing Prometheus for exporter collection.
Prometheus's prometheus.yml can be configured with -promscrape.config
For Prometheus, VictoriaMetrics has some optimizations:
-
Added extra_label=
= optional query support, which can be used for query filtering based on extra labels. For example /api/v1/query_range?extra_label=user_id=123&extra_label=group_id=456&query=, will return results containing {user_id="123",group_id="456"} in the extra tags; -
Added extra_filters[]=series_selector optional query support, which can be used for query filtering based on extended tags for rule matching. For example /api/v1/query_range?extra_filters[]={env=~"prod|staging",user="xyz"}&query=
, Will return the result containing {env=~"prod|staging",user="xyz"} in the extra tag; -
Support "start" and "end", using multiple time formats, such as 1562529662.678, 2022-03-29T01:02:03Z, 2022-03, 1h5m, etc.;
-
Added the round_digits parameter in /api/v1/query and /api/v1/query_range , which can be used to round the response value to a given number of digits after the decimal point;
-
Added the limit parameter in /api/v1/labels and /api/v1/label/
/values to limit the number of returned entries; -
Added the limit parameter in /api/v1/series to limit the number of returned entries;
-
Add /api/v1/series/count to return the total number of time series in the database;
-
Add /api/v1/status/active_queries to return the list of currently running queries;
-
Added /api/v1/status/top_queries to return the most frequently executed queries of "topByCount"; Returns "topByAvgDuration" the query with the longest average execution duration; returns "topBySumDuration" the query with the longest execution time.
In addition to supporting Prometheus as a data source, VictoriaMetrics also supports other data sources:
-
DataDog agent
-
InfluxDB-compatible agents such as Telegraf
-
Graphite-compatible agents such as StatsD
-
OpenTSDB-compatible agents
Architecture
For use cases where the acquisition rate is lower than one million data points per second, the official recommendation is to use the single-node version instead of the cluster version. The single-node version scales perfectly with the number of CPU cores, RAM and available storage space. Compared to the cluster version, The single-node version is easier to configure and operate, so think twice before choosing the cluster version.
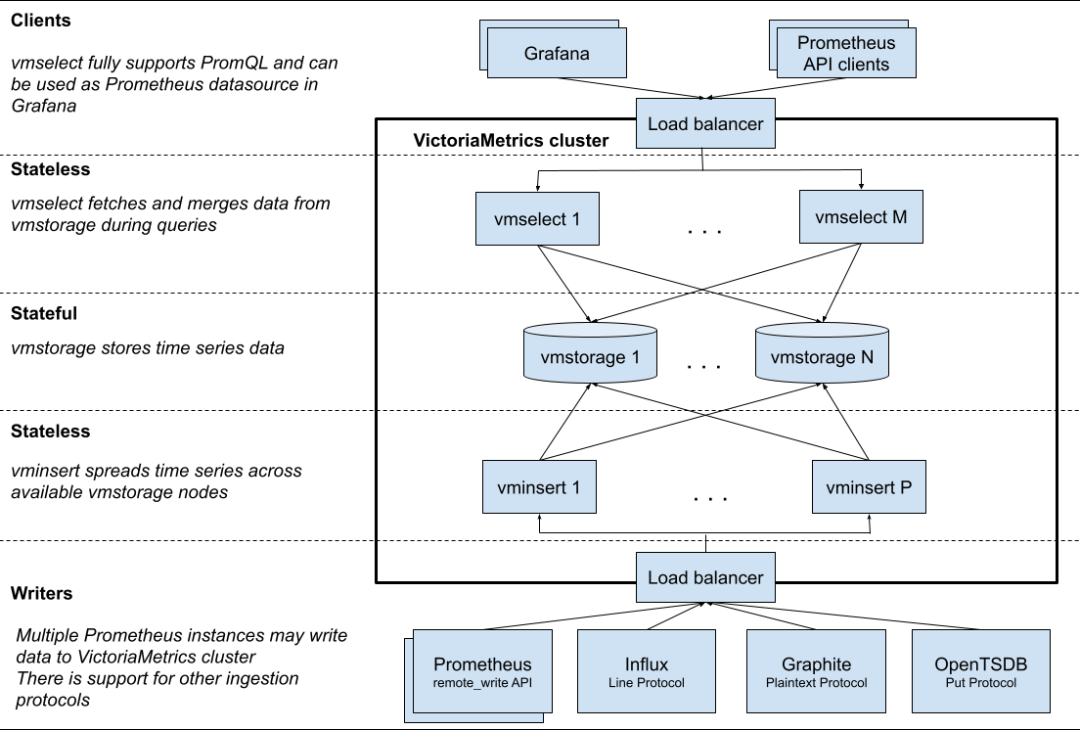
A VictoriaMetrics cluster consists of the following services:
-
vmstorage, which stores raw data and returns query data within a given time range for a given tag filter;
-
vminsert, which accepts the received data and propagates the data among the vmstorage nodes based on the calculated hash value of the "metric name and all its tags";
-
vmselect, executes the incoming query by fetching the required data from all configured vmstorage nodes.
Each service can scale independently and run on the most suitable hardware. Vmstorage nodes don't know about each other, don't communicate with each other, No data is shared either. This is a shared-nothing architecture, which increases cluster availability and simplifies cluster maintenance and cluster scaling.
VictoriaMetrics provides the following components at the open source level:
-
vmui: Responsible for vm page display, providing data query, index and cardinality query, query analysis, link analysis, job analysis panel and other features;
-
vmagent: responsible for data collection, relabeling and filtering collection, and storing data to VictoriaMetrics through the Prometheus protocol Or other storage systems that support the Prometheus protocol. Supports simultaneous replication of multiple remote storage systems after aggregating samples by time and label, And it can cache data when the transmission fails, and continue to transmit after waiting for recovery; it supports capturing targets that expose millions of time series and writing them to multiple tenants; it supports kafka reading and writing;
-
vminsert: responsible for data insertion, supporting data of different formats and different tenants;
-
vmstorage: responsible for data storage, with the characteristics of high compression ratio, low resource consumption, and high performance;
-
vmselect: Responsible for data query, supporting unified data query and multi-tenant data isolation query;
-
vmalert: Responsible for alerts, like Prometheus, supports record and alert rule configuration and sends alert notifications, allows Go templates to be used in annotations to format data, iterate or run expressions, and supports cross-tenant sending of alerts and record rules
-
vmbackup: Responsible for data backup, supports incremental backup and full backup, can do hourly, daily, weekly and monthly backup, supports local storage, GCS, Azure Blob storage, S3 storage, any storage compatible with S3 ;
-
vmrestore: Responsible for data restoration, supports interruption at any time and automatic recovery from breakpoints.
ability
save
VictoriaMetrics is configured using the "-retentionPeriod" command line flag, which takes a number followed by a time unit character "-h(ours), d(ays), w(eeks), y(ears)". If no time unit is specified, months are assumed. For example, "-retentionPeriod=3" means the data will be stored for 3 months and then deleted. The default retention period is one month.
Data Deletion
In addition to supporting the configuration of timed expiration, VictoriaMetrics also supports manual data deletion operations, using "
Force merge
VictoriaMetrics will perform data compression in the background in the form of a monthly partition to maintain good performance. You can use "http://victoriametrics:8428/internal/force_merge?partition_prefix=YYYY_MM" to perform mandatory data compression, which will immediately return the request result in an asynchronous form and perform data compression tasks in the background. When you need to delete data immediately, you can use forced merge to trigger data deletion.
Data import and export
VictoriaMetrics supports importing data using a dedicated Agent interface:
-
Prometheus remote_write API
-
DataDog submit metrics API
-
Graphite plaintext protocol
-
OpenTSDB telnet put protocol
-
OpenTSDB http api/put protocol
Support for importing data using the VictoriaMetrics unified interface:
-
/api/v1/import, export in json format;
-
/api/v1/import/csv, export in csv format;
-
/api/v1/import/native, export binary format.
Alternatively, data can also be exported using the export interface:
-
/api/v1/export, export in json format;
-
/api/v1/export/csv, export csv format;
-
/api/v1/export/native, export binary format.
On the VictoriaMetrics interface side, in the import and export interfaces, the data format is consistent, and the exported data can be directly used for data import.
Deduplication
VictoriaMetrics will deduplicate according to the value configured in "-dedup.minScrapeInterval", leaving only one original sample, Keep the data with the largest timestamp in the configuration cycle. For example "-dedup.minScrapeInterval=60s", will keep 60s A single raw sample of the largest timestamp in the interval. If the timestamps are consistent, keep the data randomly.
Multiple identically configured vmagent or Prometheus instance writes data to the same VictoriaMetrics instance, deduplication reduces disk space usage.
Storage
VictoriaMetrics will store time series data in a MergeTree-like data structure. When inserted, VictoriaMetrics Accumulate up to 1s worth of data and dump it to storageDataPath>/data/small/YYYY_MM/ on disk subdirectories, forming a part with the following name pattern: "rowsCount_blocksCount_minTimestamp_maxTimestamp" . Each part consists of two "columns": value and timestamp. These are sorted and compressed raw time series values. Additionally, part contains index files for searching for specific series in value and timestamp files.
Parts are periodically merged into larger parts, and the resulting parts are constructed under the <-storageDataPath>/data/{small,big}/YYYY_MM/tmp subdirectory. When the generated part is complete, it is automatically moved from tmp to its own subdirectory, while the source part is automatically deleted. The end result is, The source part is replaced by a single larger part in the <-storageDataPath>/data/{small,big}/YYYY_MM/ directory.
VictoriaMetrics will not merge parts if the part's summary size exceeds the available disk space. This prevents potential out of disk space errors during the merge. In the case of insufficient free disk space, the number of parts may increase significantly over time. This adds overhead during data query, Because VictoriaMetrics needs to read data from more parts per request. This is why it is recommended to At least 20% free disk space under the directory indicated by the "-storageDataPath" command line flag.
Information about the merge process can be viewed in the Grafana dashboard.
The merging process improves compression and keeps the number of parts on disk relatively low. The benefits of performing the merge process are as follows:
-
It improves query performance, because each query checks fewer parts;
-
It reduces the number of data files because each section contains a fixed number of files.
Storage or merging will not only save part of the part, the part will be in the form of the data as a whole, or all of them will be saved successfully, or all of them will fail. part is immutable.
Monitoring
VictoriaMetrics exports internal metrics in Prometheus exposure format on the "/metrics" page. These metrics can be fetched via vmagent or Prometheus. Or, when -selfScrapeInterval Single-node VictoriaMetrics can self-grab metrics when the command-line flag is set to a duration greater than 0.
VictoriaMetrics exposes currently running queries and their execution times on the "/api/v1/status/active_queries" page.
VictoriaMetrics exposes the longest executing queries on the "/api/v1/status/top_queries" page.
TSDB Status
VictoriaMetrics returns TSDB statistics on the "/api/v1/status/TSDB" page in a Prometheus-like manner:
-
topN=N, where N is the number of responses. By default, the first 10 are returned;
-
date=YYYY-MM-DD, where YYYY-MM-DD is the date the statistics were collected. By default, statistics for the current day are collected;
-
focusLabel=LABEL_NAME, returns the label value with the largest number of time series given LABEL_NAME in the seriesCountByFocusLabelValue list;
-
match[]=SELECTOR, where SELECTOR is an arbitrary time series selector used to consider series during statistical computations. By default, all series will be considered;
-
extra_label=LABEL=VALUE, expand label screening.
Push metrics
When there is a scenario where metrics cannot be pulled, VictoriaMetrics supports metric push through the push mode in the Prometheus data format:
-
-pushmetrics.url, push address, such as "-pushmetrics.url=http://victoria-metrics:8428/api/v1/import/prometheus";
-
-pushmetrics.extraLabel, extended label, supports adding labels to push data in the form of label="value";
-
-pushmetrics.interval, the push period, the default is 10s.
Cache
VictoriaMetrics uses various internal caches. During a graceful shutdown (for example, when VictoriaMetrics is stopped by sending a SIGINT signal), These caches are stored into the "<-storageDataPath>/cache" directory. The cache will be read the next time VictoriaMetrics starts. Sometimes it is necessary to delete these caches on the next boot. This can be performed by placing the reset_cache_on_startup file in the "<-storageDataPath>/cache" directory before restarting VictoriaMetrics.
VictoriaMetrics uses various in-memory caches to speed up data ingestion and query performance. Each type of cache metrics can be exported on the "/metrics" page:
-
vm_cache_size_bytes, actual cache size;
-
vm_cache_size_max_bytes, cache size limit;
-
vm_cache_requests_total, the number of cache requests;
-
vm_cache_misses_total, the number of cache misses;
-
vm_cache_entries, the number of entries in the cache.
Support for viewing cache metrics on the Grafana dashboard, which shows the current memory usage of each type of cache, as well as the cache hit ratio. If the hit rate is close to 100%, the cache is already very efficient and no tuning is needed.
Other
Support many features that Prometheus has, such as Prometheus's label rewriting, federation and other features.
Comparison with Prometheus
Advantage:
-
Performance advantage. Under the same configuration and collection pressure, the storage space can be reduced by up to 7 times compared with Prometheus, Disk read and write peaks can be reduced by up to 3-4 times, and memory usage can be reduced by up to 7 times;
-
Better horizontal expansion and high availability solutions. The VictoriaMetrics cluster mode decouples the architecture at the functional level by componentizing various capabilities. Since the vmselect and vminsert components responsible for reading and writing are stateless components, they can be flexibly scaled horizontally according to the reading and writing pressure; Although the vmstorage component responsible for storage is a stateful component, when the storage pressure increases, it also supports horizontal expansion. After expansion, only the upstream and downstream components need to be updated. The vmselect and vminsert components are configured and restarted to improve the storage capacity of the VictoriaMetrics cluster; when collecting pressure, You can use the expansion vmagent and vmagent's collection and grouping capabilities to perform distributed pressure collection;
-
Data multi-tenancy capability. VictoriaMetrics supports putting different types of data into different tenants, and each tenant passes accountID or in the form of accountID:projectID to distinguish it in the requested url. The number of tenants does not affect performance, It mainly depends on the active total time series of all tenants. The data of each tenant is evenly distributed in the back-end vmstorage storage, but cross-tenant data query is not supported.
shortcoming:
-
There is no WAL log similar to Prometheus, and some data may be lost due to a sudden failure. When Prometheus receives the data, Data will be written to memory first, and then to disk at regular intervals. In order to prevent data loss before writing to disk, it will also simply write to WAL while writing to memory In the file, when a failure occurs, the current state can be quickly restored through WAL. While VictoriaMetrics is writing, Using Go's chan as the data cache queue, multi-collaboration to achieve data processing, compression, storage and other operations, there is a case of cache data loss under failure;
-
In order to optimize storage to a greater extent, some data precision will be lost. The Vmstorage component supports configuring the precision storage range (1-64, 64 means no loss), so as to improve the speed during data reading and writing.
Install
Use helm to deploy VictoriaMetrics cluster mode.
Install helm and add the chart helm repository:
Export the configuration file and configure it for deployment:
Configuration checks can be performed with the following command:
helm install victoria-metrics vm/victoria-metrics-cluster -f values.yaml -n victoria-metrics --debug --dry-run
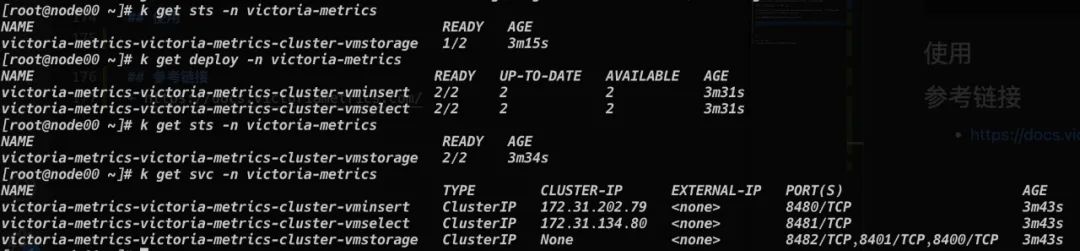
Deploy victoria-metrics-cluster according to the configuration file:
After a while, Helm will prompt that the installation is successful, and you can see that all resources have been deployed.
use
Adjust the service of victoria-metrics-victoria-metrics-cluster-vminsert with victoria-metrics-victoria-metrics-cluster-vmselect service, from Change the ClusterIP mode to NodePort mode to provide external access capabilities. Modify the existing Prometheus configuration and add:
Write the data of Prometheus to VictoriaMetrics, through the UI address of VictoriaMetrics http://IP:NodePort/select/0/vmui, you can view the data collected by Prometheus.
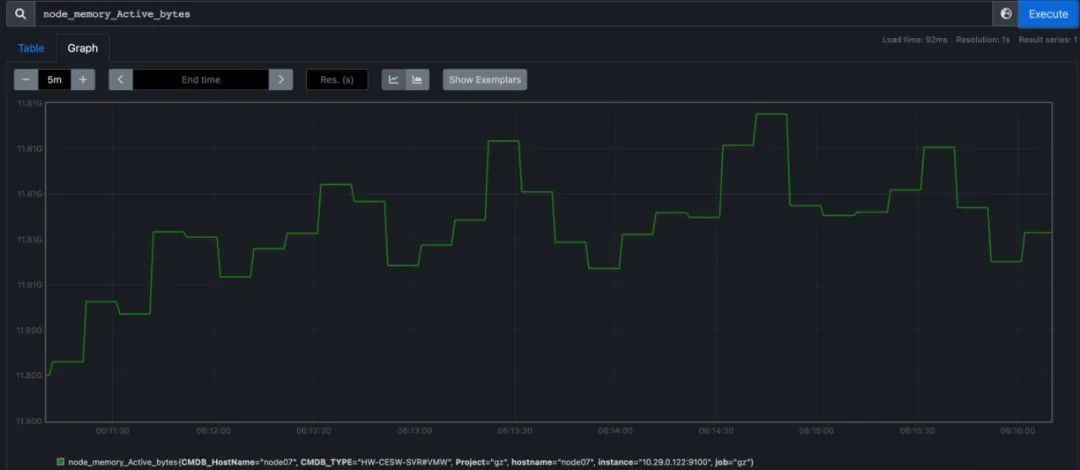
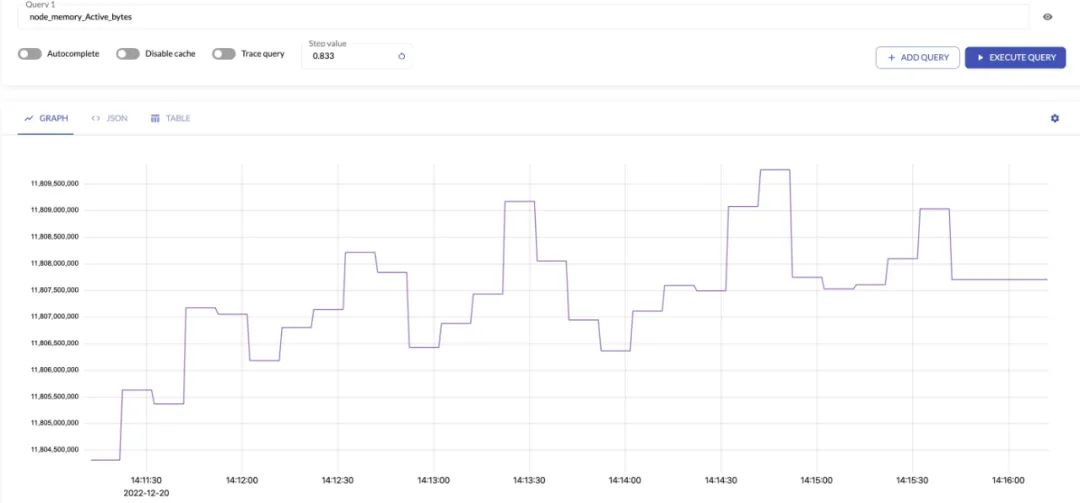
It can be seen that the two data are basically consistent.
References: https://docs.victoriametrics.com/