Data Collection
Data Collection is mainly to centrally manage and display the entrance of the cluster installation collection plug-in insight-agent , which helps users quickly view the health status of the cluster collection plug-in, and provides a quick entry to configure collection rules.
Insight supports creating a CRD ServiceMonitor through Container Management to meet your custom service discovery collection needs. Users can define the Namespace scope for Pod discovery and use matchLabel to select the Services to be monitored.
Prerequisites
The cluster has installed the Helm application insight-agent and it is running.
Steps
-
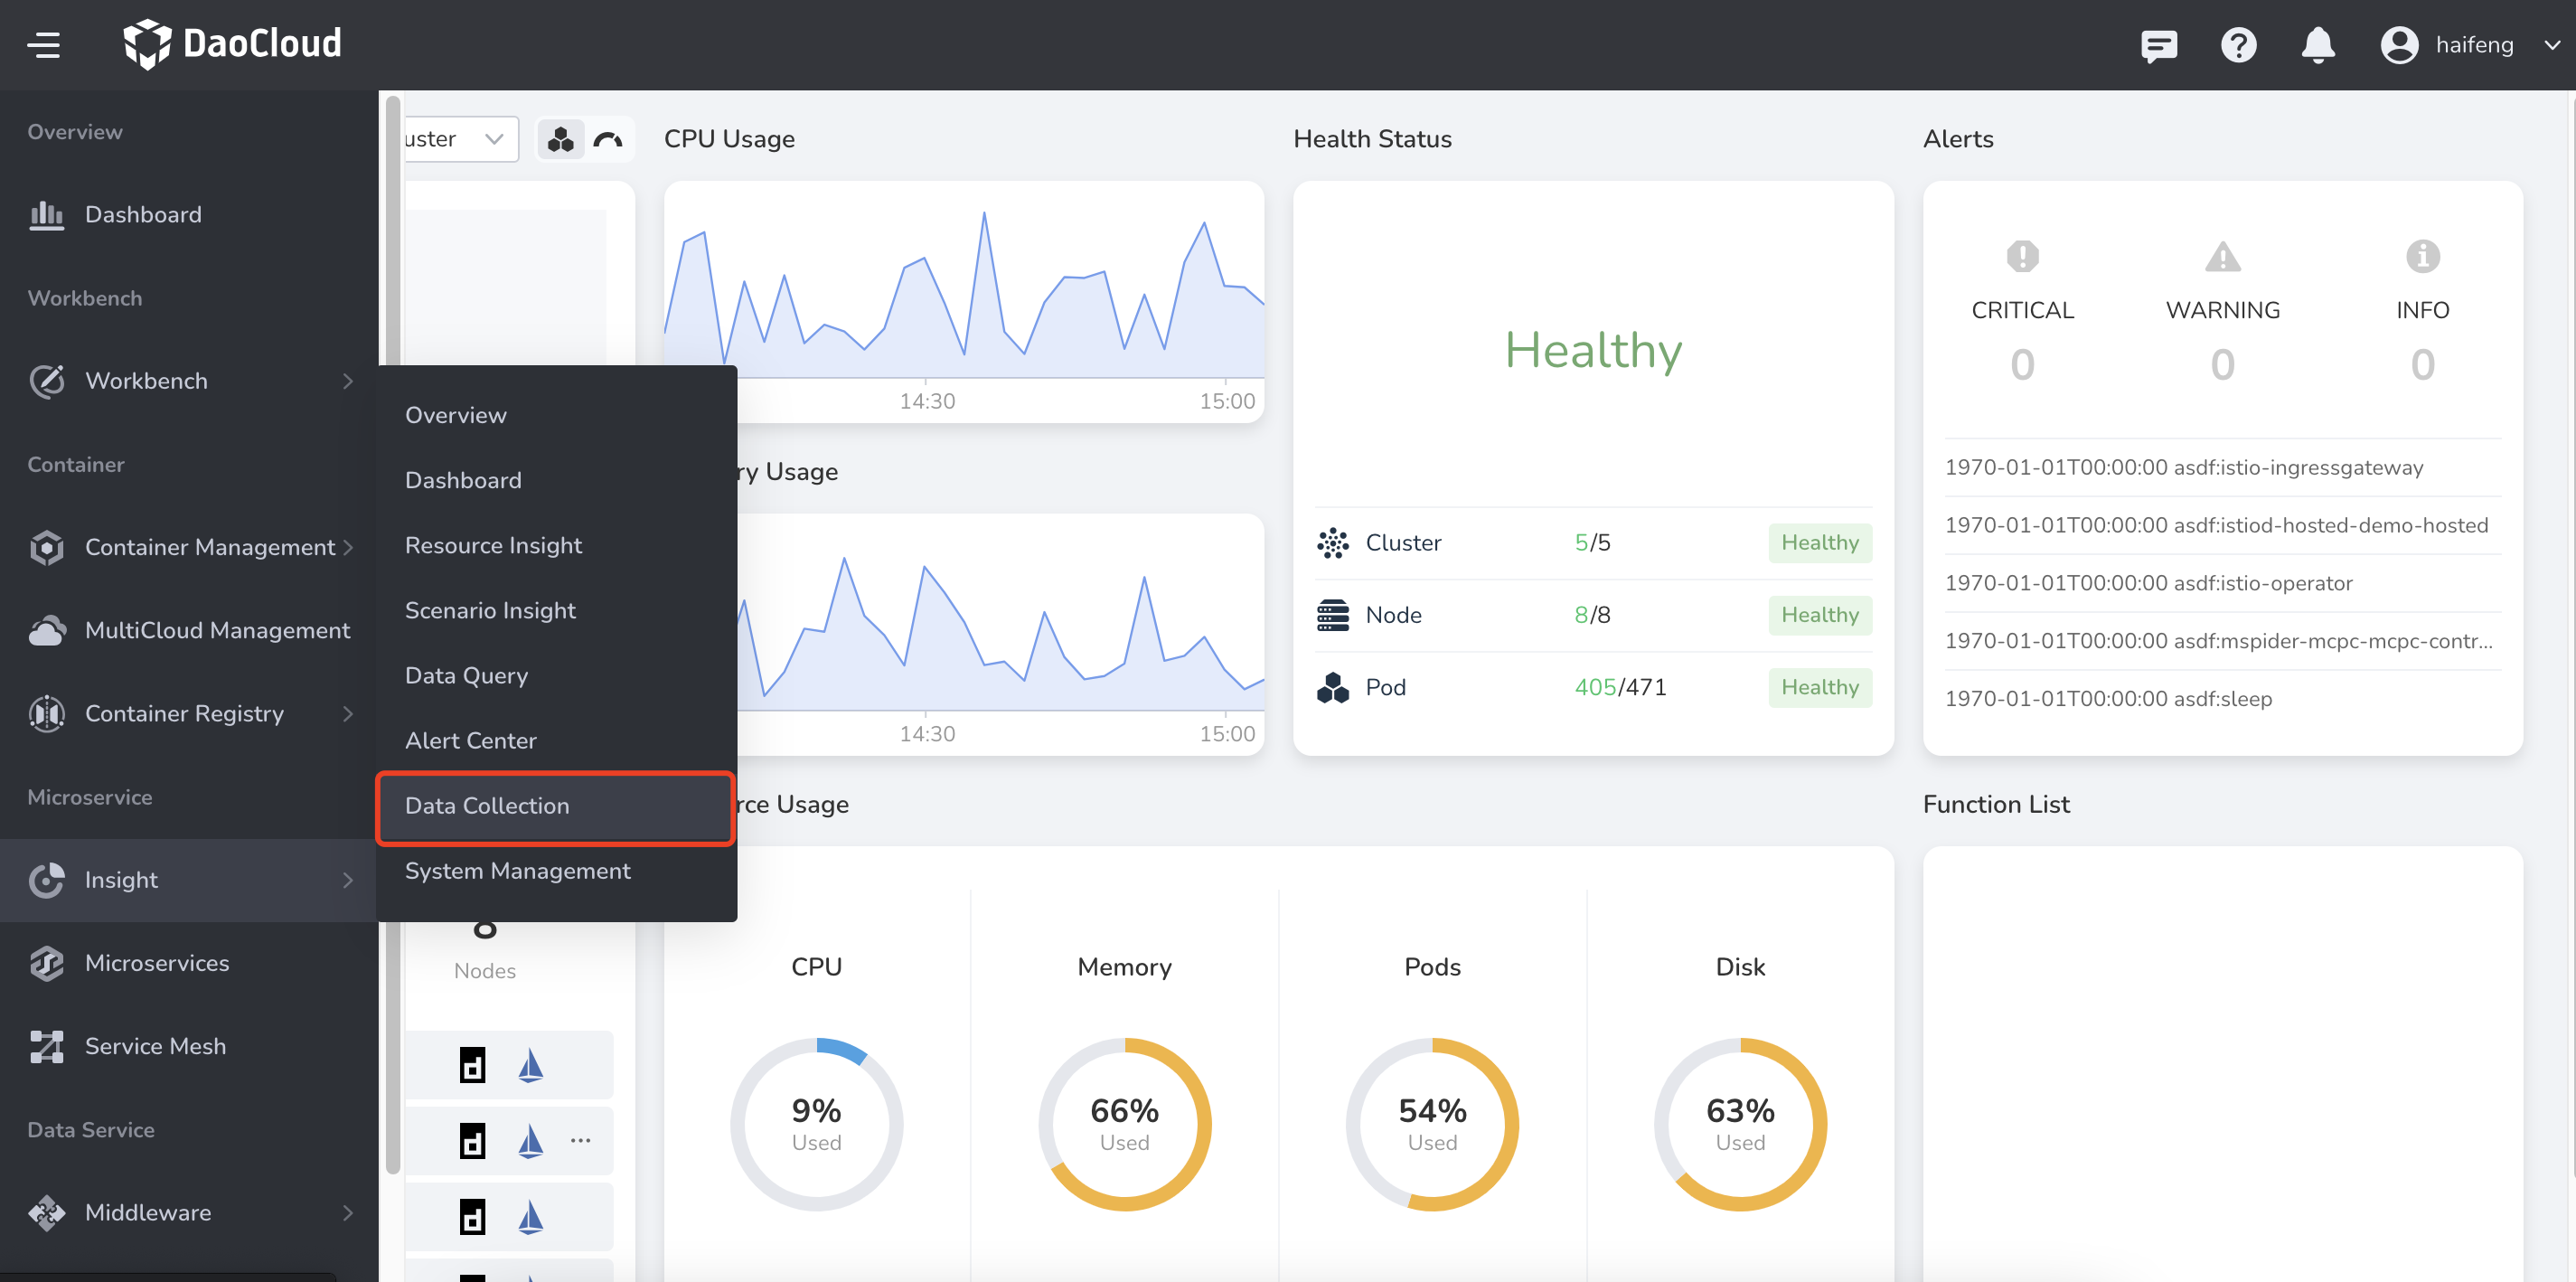
Click ≡ in the upper left corner and select Insight.
-
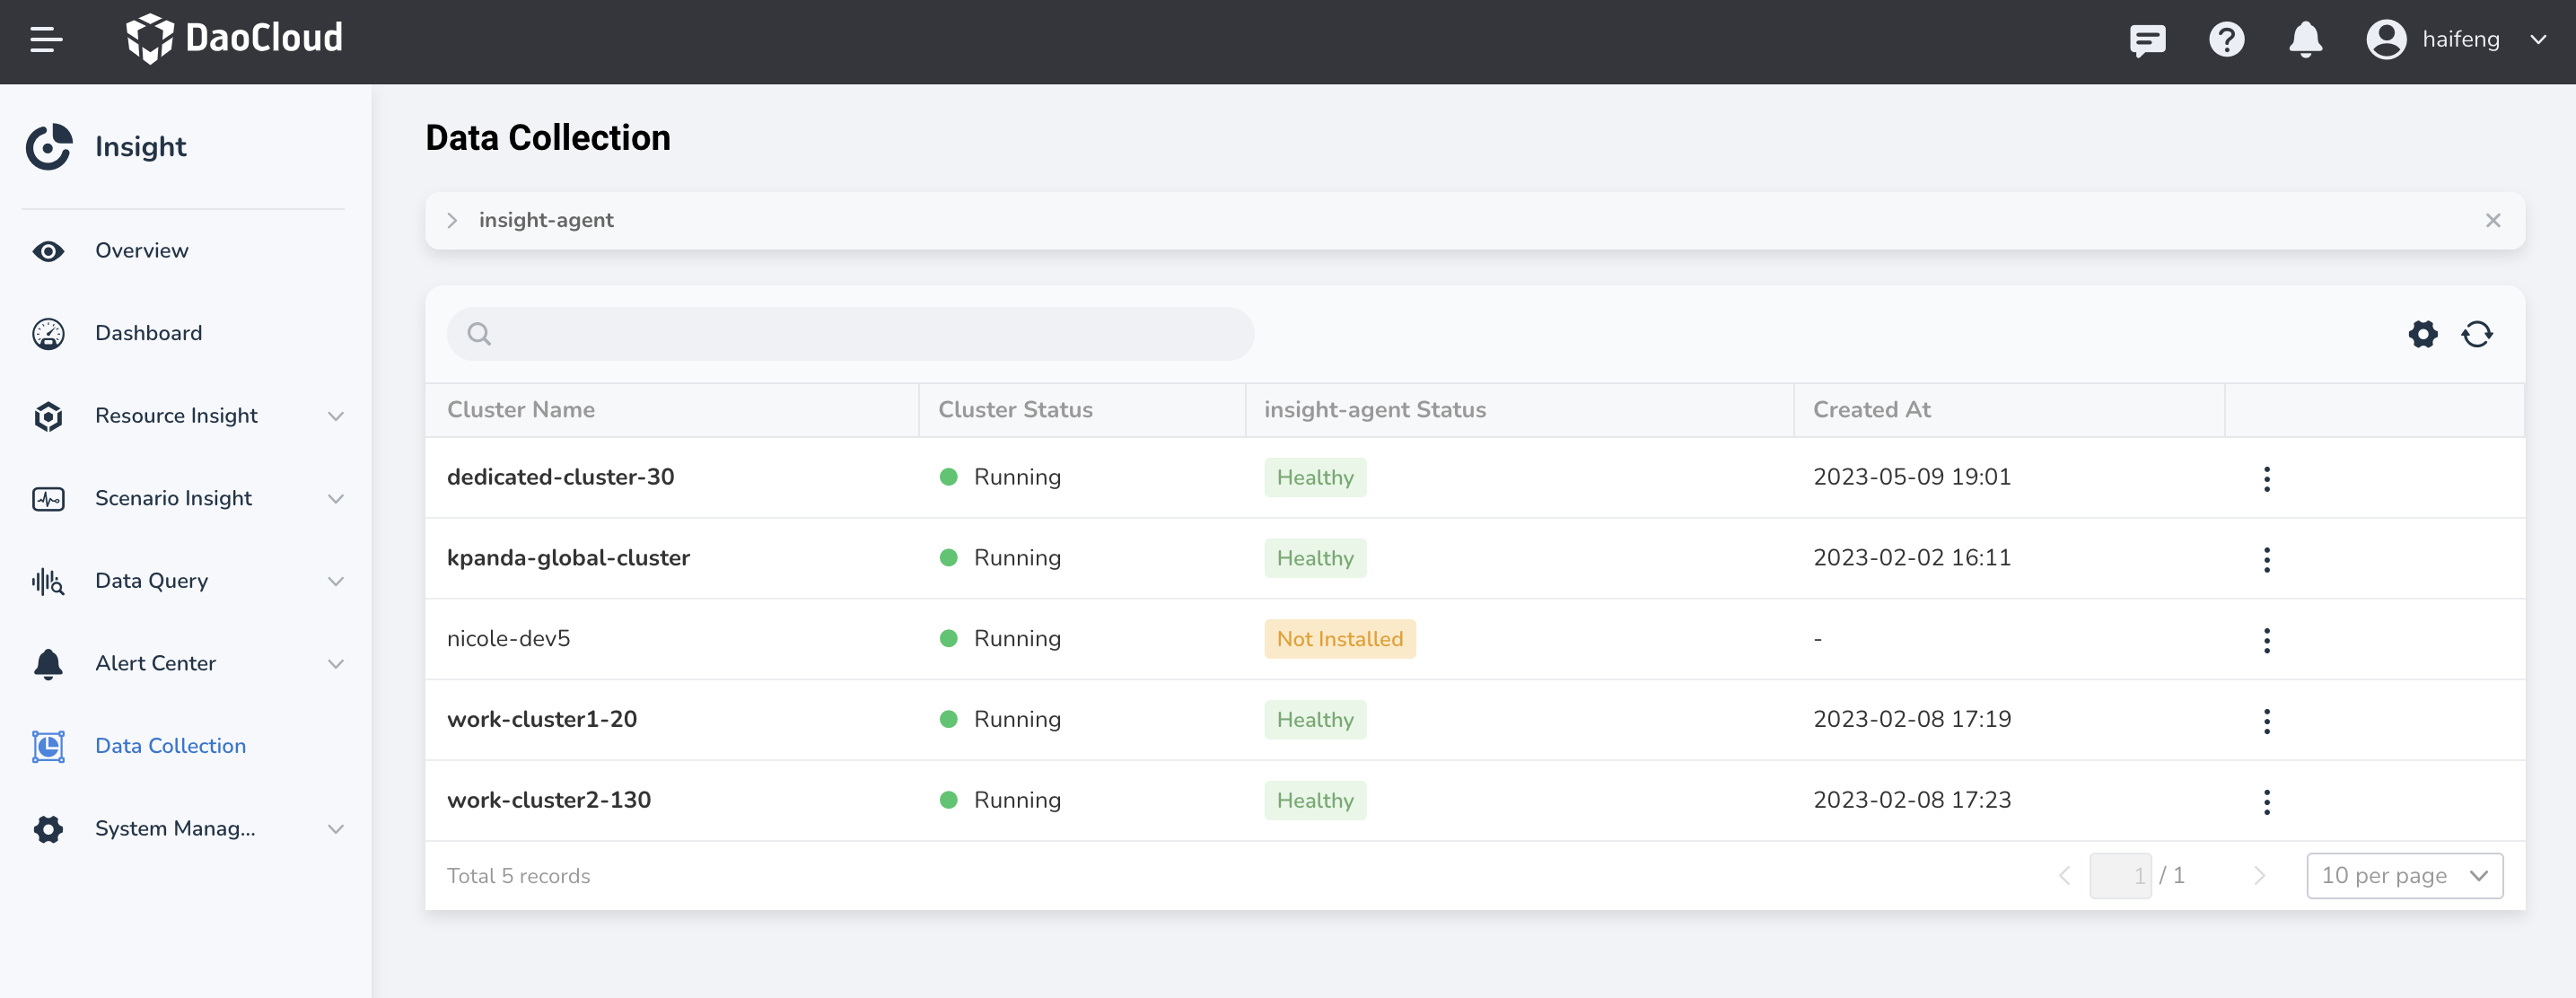
Select Data Collection in the left navigation bar to view the status of all cluster collection plug-ins.
-
When the cluster is connected to insight-agent and is running, click a cluster name to enter the details.

-
On the collection details page of the cluster, select the Metrics Collection Status tab to view the detailed status of the Targets collected by Prometheus in the current cluster and the labels of each Target.

-
In the Service Monitor tab, click the shortcut link to jump to Container Management -> Custom Resources to add a service discovery rule.

Configuration Guide
Choosing Between ServiceMonitor and PodMonitor
In DCE’s Insight monitoring system, each workload cluster is deployed with a Prometheus stack. ServiceMonitor and PodMonitor are CRDs provided by Prometheus Operator for automatic discovery and metrics scraping . Both are implemented based on the Kubernetes Operator pattern, enabling us to manage Prometheus configurations declaratively.
ServiceMonitor focuses on Services .
-
Features: It discovers monitoring targets by matching Services. ServiceMonitor looks for all Services with matching labels, then automatically generates Prometheus scrape configurations based on their exposed ports and paths.
-
Advantages: As long as your application is deployed as a Service, Prometheus can automatically discover and monitor it. Even if the Pods behind it change dynamically, there’s no need to update the configuration manually.
-
Use case: Applications that expose metrics endpoints via Services.
PodMonitor focuses on Pods .
-
Features: It directly discovers monitoring targets by matching Pod labels. PodMonitor looks for all Pods with matching labels, then uses their IPs and the specified ports/paths to generate scrape configurations.
-
Advantages: High flexibility; you can match monitoring targets using any Pod labels.
-
Use case: When your application does not expose metrics via a Service, or when you need fine-grained monitoring at the Pod level (e.g., monitoring Sidecar containers).
Recommended strategy: Try ServiceMonitor first . Use PodMonitor only when ServiceMonitor cannot meet your monitoring needs.
ServiceMonitor
The design principle of ServiceMonitor is “service-oriented.” It focuses on Kubernetes Service resources, not the underlying Pods. It is the preferred solution for most application monitoring scenarios.
Example ServiceMonitor configuration:
apiVersion: monitoring.coreos.com/v1
kind: ServiceMonitor
metadata:
  name: micrometer-demo # Name of the ServiceMonitor
  namespace: insight-system # Namespace of the ServiceMonitor
  labels:
    # Note: Only ServiceMonitors with this label will be used by insight
    operator.insight.io/managed-by: insight
spec:
  endpoints:
    - honorLabels: true
      interval: 30s
      path: /actuator/prometheus
      port: http
  namespaceSelector:
    matchNames:
      - insight-system
  selector:
    matchLabels:
      micrometer-prometheus-discovery: "true"
This ServiceMonitor declares that Prometheus should search the insight-system namespace for all Services labeled with micrometer-prometheus-discovery: "true", then scrape metrics from their http ports every 30 seconds at the /actuator/prometheus path.
The endpoints field is an array, allowing multiple endpoints to be created. Each endpoint includes three key fields:
port(required): The port to collect data from. This must match the name of the port defined in the Service.path(optional): The scrape path. In this example,/actuator/prometheus. The default path is/metrics.interval(optional): The scraping interval for the endpoint. In this example, 30s. Defaults to Prometheus’ global scrape interval.
PodMonitor
The design principle of PodMonitor is “instance-oriented.” It directly focuses on Kubernetes Pod resources.
Example PodMonitor configuration:
apiVersion: monitoring.coreos.com/v1
kind: PodMonitor
metadata:
  name: insight-agent-otel-kubernetes-collector-agent
  namespace: insight-system
  labels:
    # Note: Only PodMonitors with this label will be used by insight
    operator.insight.io/managed-by: insight
spec:
  podMetricsEndpoints:
    - port: metrics
  namespaceSelector:
    matchNames:
      - insight-system
  selector:
    matchLabels:
      app.kubernetes.io/instance: insight-agent
      app.kubernetes.io/name: opentelemetry-kubernetes-collector
      component: standalone-collector
This PodMonitor declares that Prometheus should look in the insight-system namespace for Pods with the three specified labels, then scrape metrics from their metrics port at the default /metrics path.
Key fields of the PodMonitor spec:
selector(required): A Pod selector used to filter Pods.namespaceSelector(optional, but recommended): A namespace selector that limits the search scope for Pods.podMetricsEndpoints(required): A list of scrape configurations that define how Prometheus scrapes metrics from the selected Pods.
Details of the podMetricsEndpoints fields:
port(required): The port to scrape from the Pod. The value (metrics) refers to a named port defined in the Pod.spec.containers.portslist, e.g.:
path(optional): The HTTP path for scraping metrics. Defaults to/metrics.interval(optional): The scrape interval. Defaults to Prometheus’ global scrape interval.
ScrapeConfig: A New Choice for Collection
🔥 Note: ScrapeConfig is supported starting from Insight Agent v0.38.0.
In Kubernetes monitoring, ServiceMonitor and PodMonitor cover most service discovery needs. However, they don’t address all Prometheus configuration scenarios. To handle more complex and flexible scrape configurations, Prometheus Operator introduces ScrapeConfig .
ScrapeConfig is designed to provide a nearly one-to-one mapping with Prometheus’ native scrape_configs block as a Kubernetes resource. It complements ServiceMonitor and PodMonitor and addresses key challenges:
- Complete Kubernetes service discovery: Beyond Pods and Services, Kubernetes can expose metrics through Nodes, Ingress, and EndpointSlices.
- Monitoring non-Kubernetes resources: Core capability is allowing users to bypass Kubernetes service discovery, using the
static_configsfield to monitor external targets (e.g., VMs, physical servers, external PaaS services). - Unlocking more service discovery mechanisms: Integrates Prometheus’ built-in SD mechanisms into the Operator framework.
- Unified declarative management: Previously, external targets were managed using
additionalScrapeConfigsSecrets.ScrapeConfigbrings all collection configs into the Kubernetes API for consistent, declarative management.
ScrapeConfig
Example: Using static_config to monitor external VMs
This example monitors two external VMs running Node Exporter (IP: 10.0.1.10, 10.0.1.11):
apiVersion: monitoring.coreos.com/v1alpha1
kind: ScrapeConfig
metadata:
  name: external-node-exporter
  namespace: monitoring
  labels:
    # Note: Only ScrapeConfigs with this label will be used by insight (supported since v0.38.3)
    operator.insight.io/managed-by: insight
spec:
  staticConfigs:
    - targets: ['10.0.1.10:9100', '10.0.1.11:9100']
      labels:
        job: 'external-node-exporter'
        env: 'production'
  relabelings:
    - sourceLabels: [__address__]
      targetLabel: instance
      regex: '([^:]+):.*'
      replacement: '${1}'
Configuration breakdown:
-
staticConfigs: Defines a set of static monitoring targets.targets: Specifies theip:portlist of scrape targets.labels: Addsjobandenvlabels to all time series data collected from these targets, aiding queries and aggregation.
-
relabelings: Demonstrates an advanced optional usage. It extracts the IP from the__address__label using regex and assigns it to theinstancelabel for clearer instance identification.