Dashboard
Grafana is a cross-platform open source visual analysis tool. Insight uses open source Grafana to provide monitoring services, and supports viewing resource consumption from multiple dimensions such as clusters, nodes, and namespaces.
For more information on open source Grafana, see Grafana Official Documentation.
Steps
-
Select Dashboard from the left navigation panel.
-
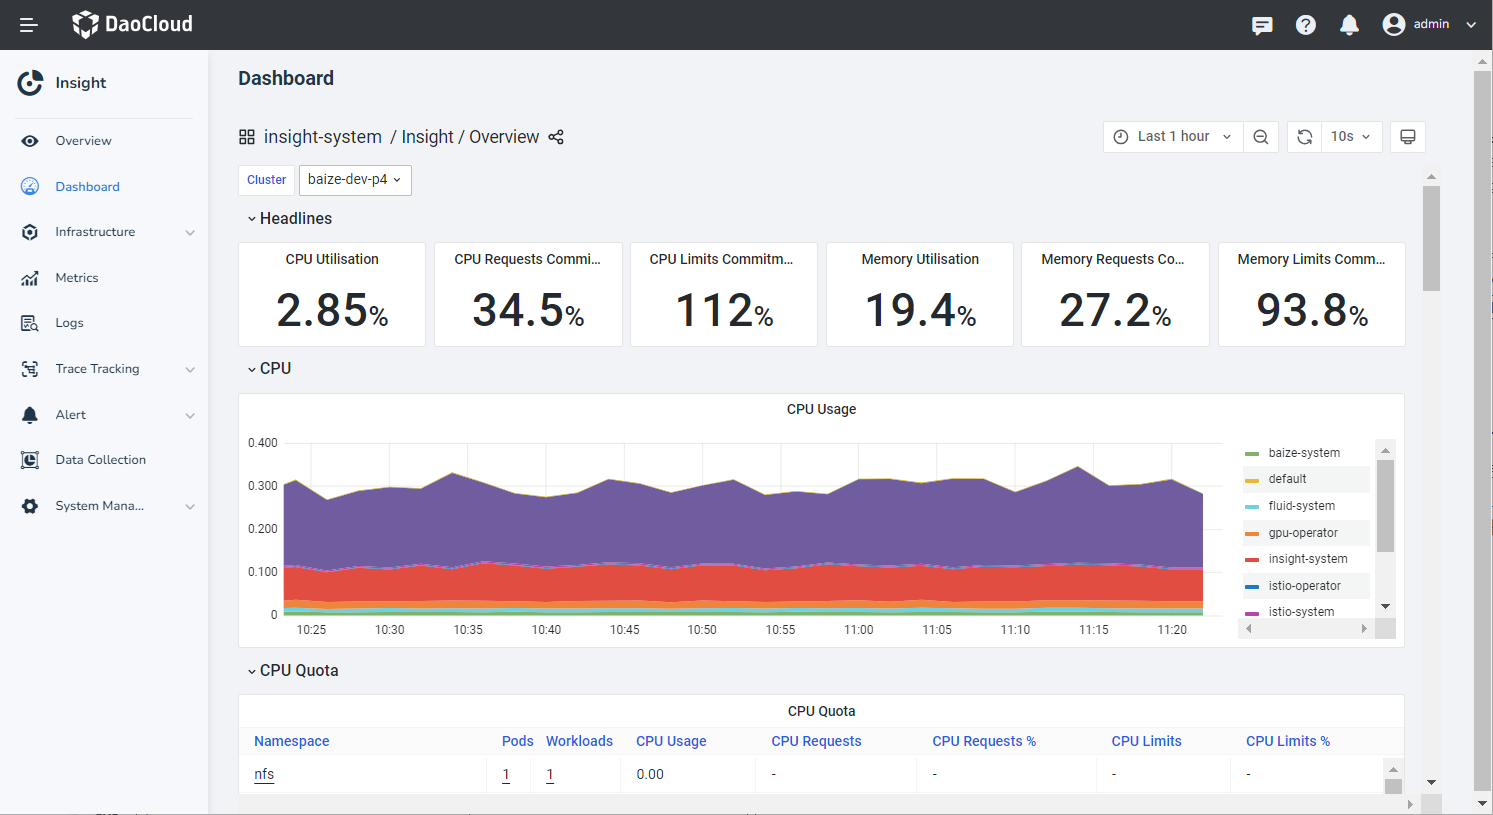
In the Insight / Overview dashboard, you can view the resource usage of multiple clusters and analyze resource usage, network, storage, and more based on dimensions such as namespaces and container groups.
-
Click the dropdown menu in the upper-left corner of the dashboard to switch between clusters.
-
Click the lower-right corner of the dashboard to switch the time range for queries.
-
-
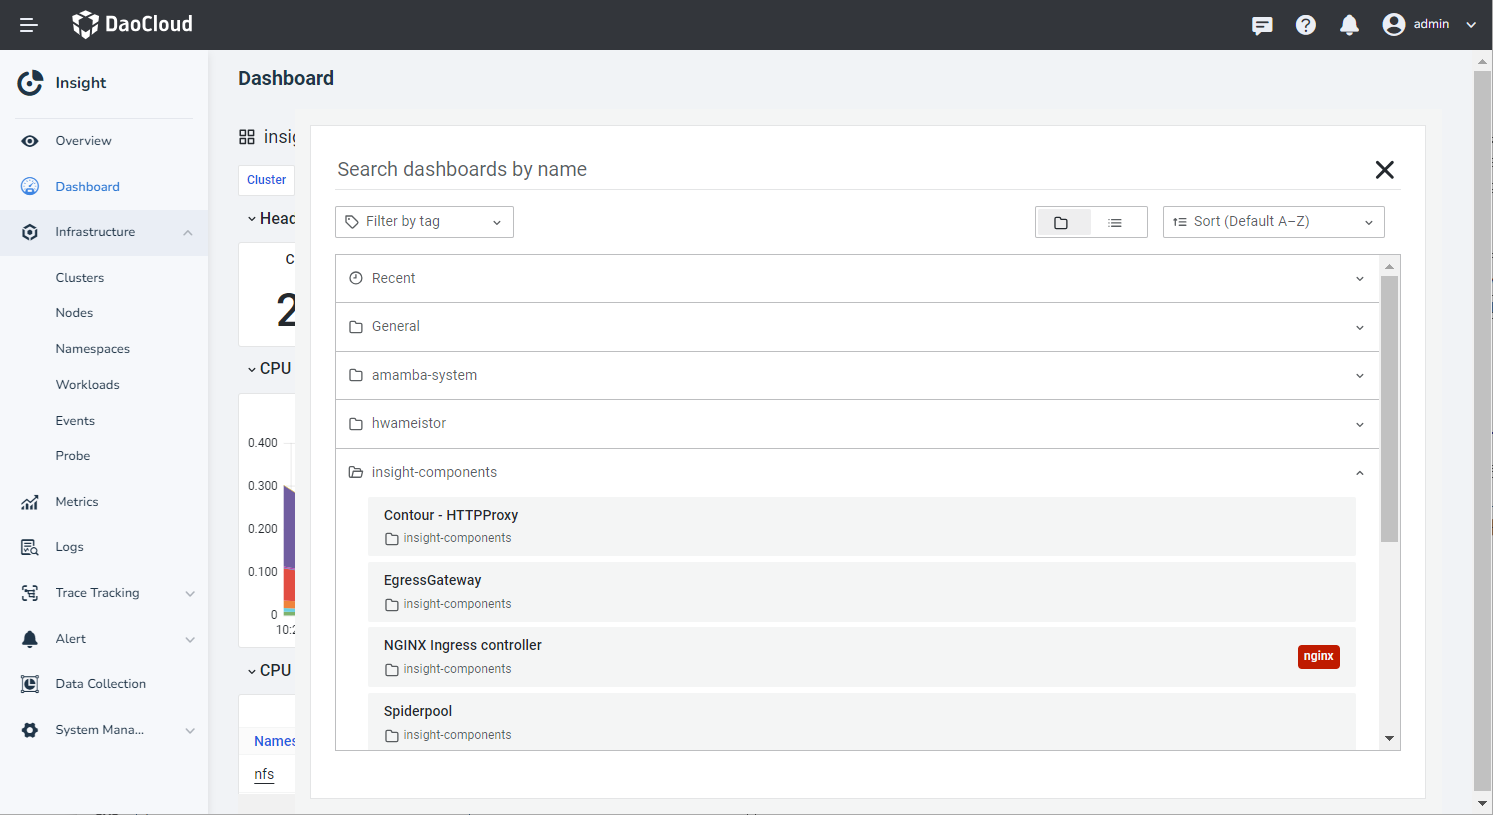
Insight provides several recommended dashboards that allow monitoring from different dimensions such as nodes, namespaces, workloads, etc. Switch between dashboards by clicking the insight-system / Insight / Overview section.
Note
-
For accessing Grafana UI, refer to Access Native Grafana.
-
For importing custom dashboards, refer to Importing Custom Dashboards.