Log query
By default, Insight collects node logs, container logs, and Kubernetes audit logs. In the log query page, you can search for standard output (stdout) logs within the permissions of your login account. This includes node logs, product logs, and Kubernetes audit logs. You can quickly find the desired logs among a large volume of logs. Additionally, you can use the source information and contextual raw data of the logs to assist in troubleshooting and issue resolution.
Prerequisites
The cluster has insight-agent installed and the application is in running state.
Query log
-
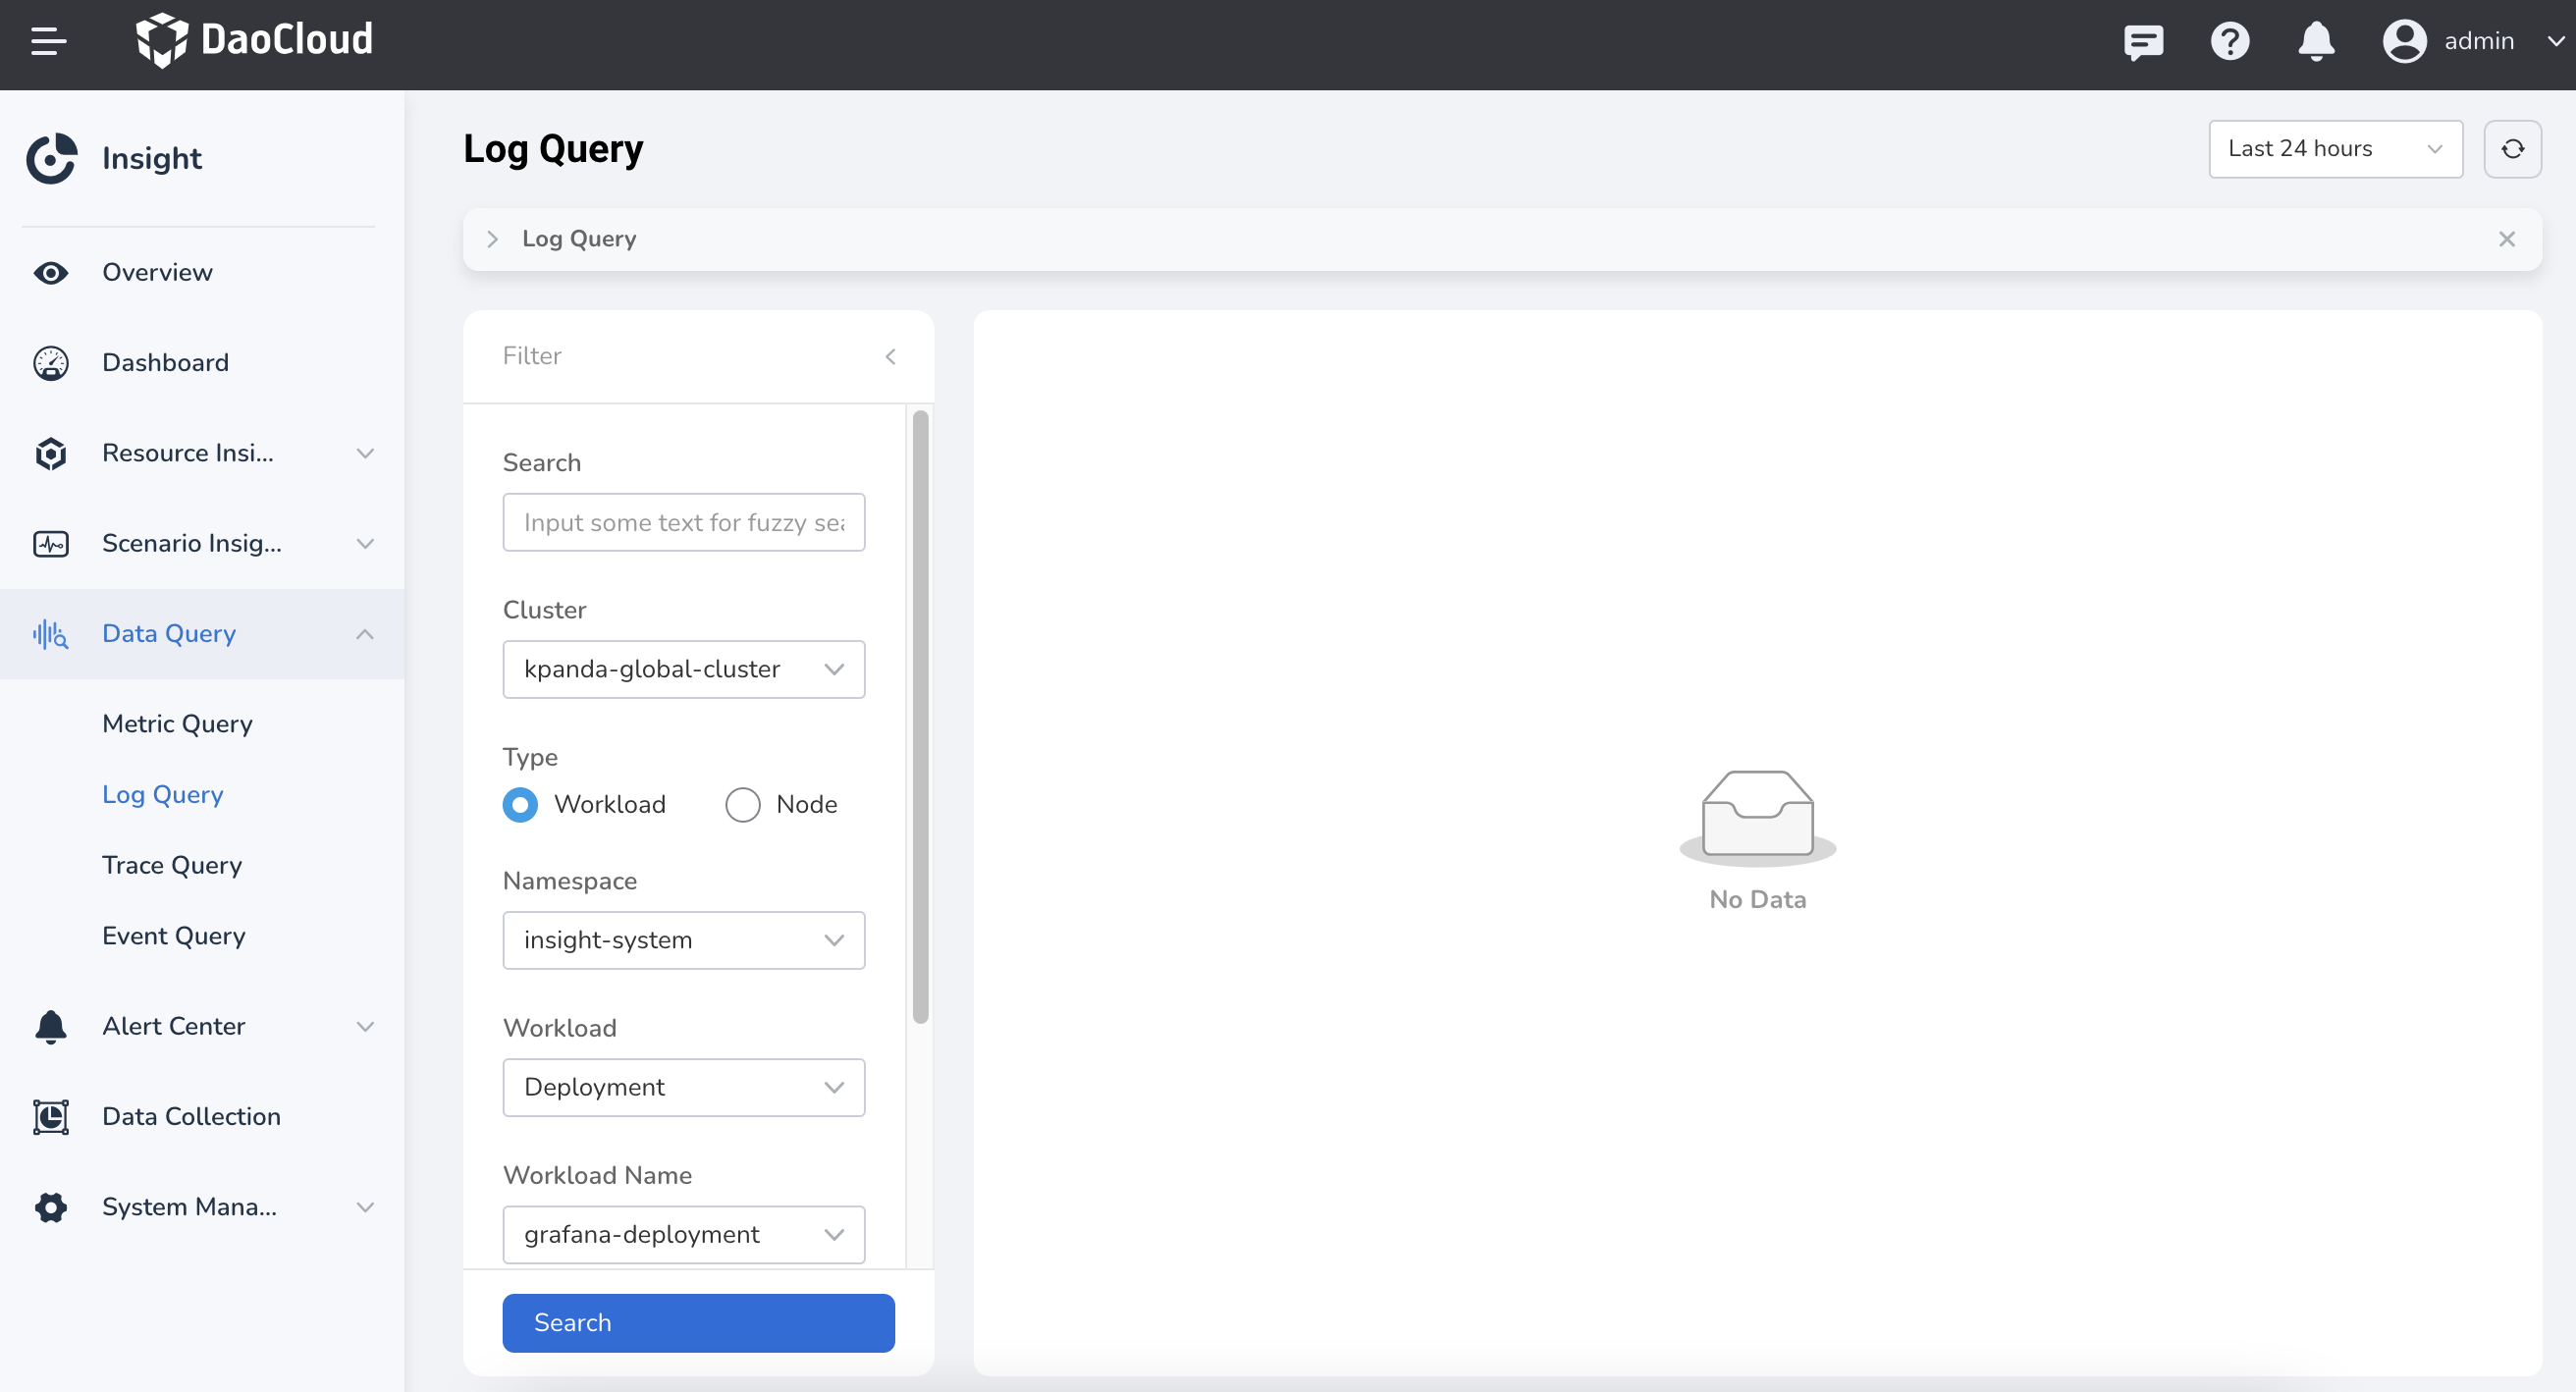
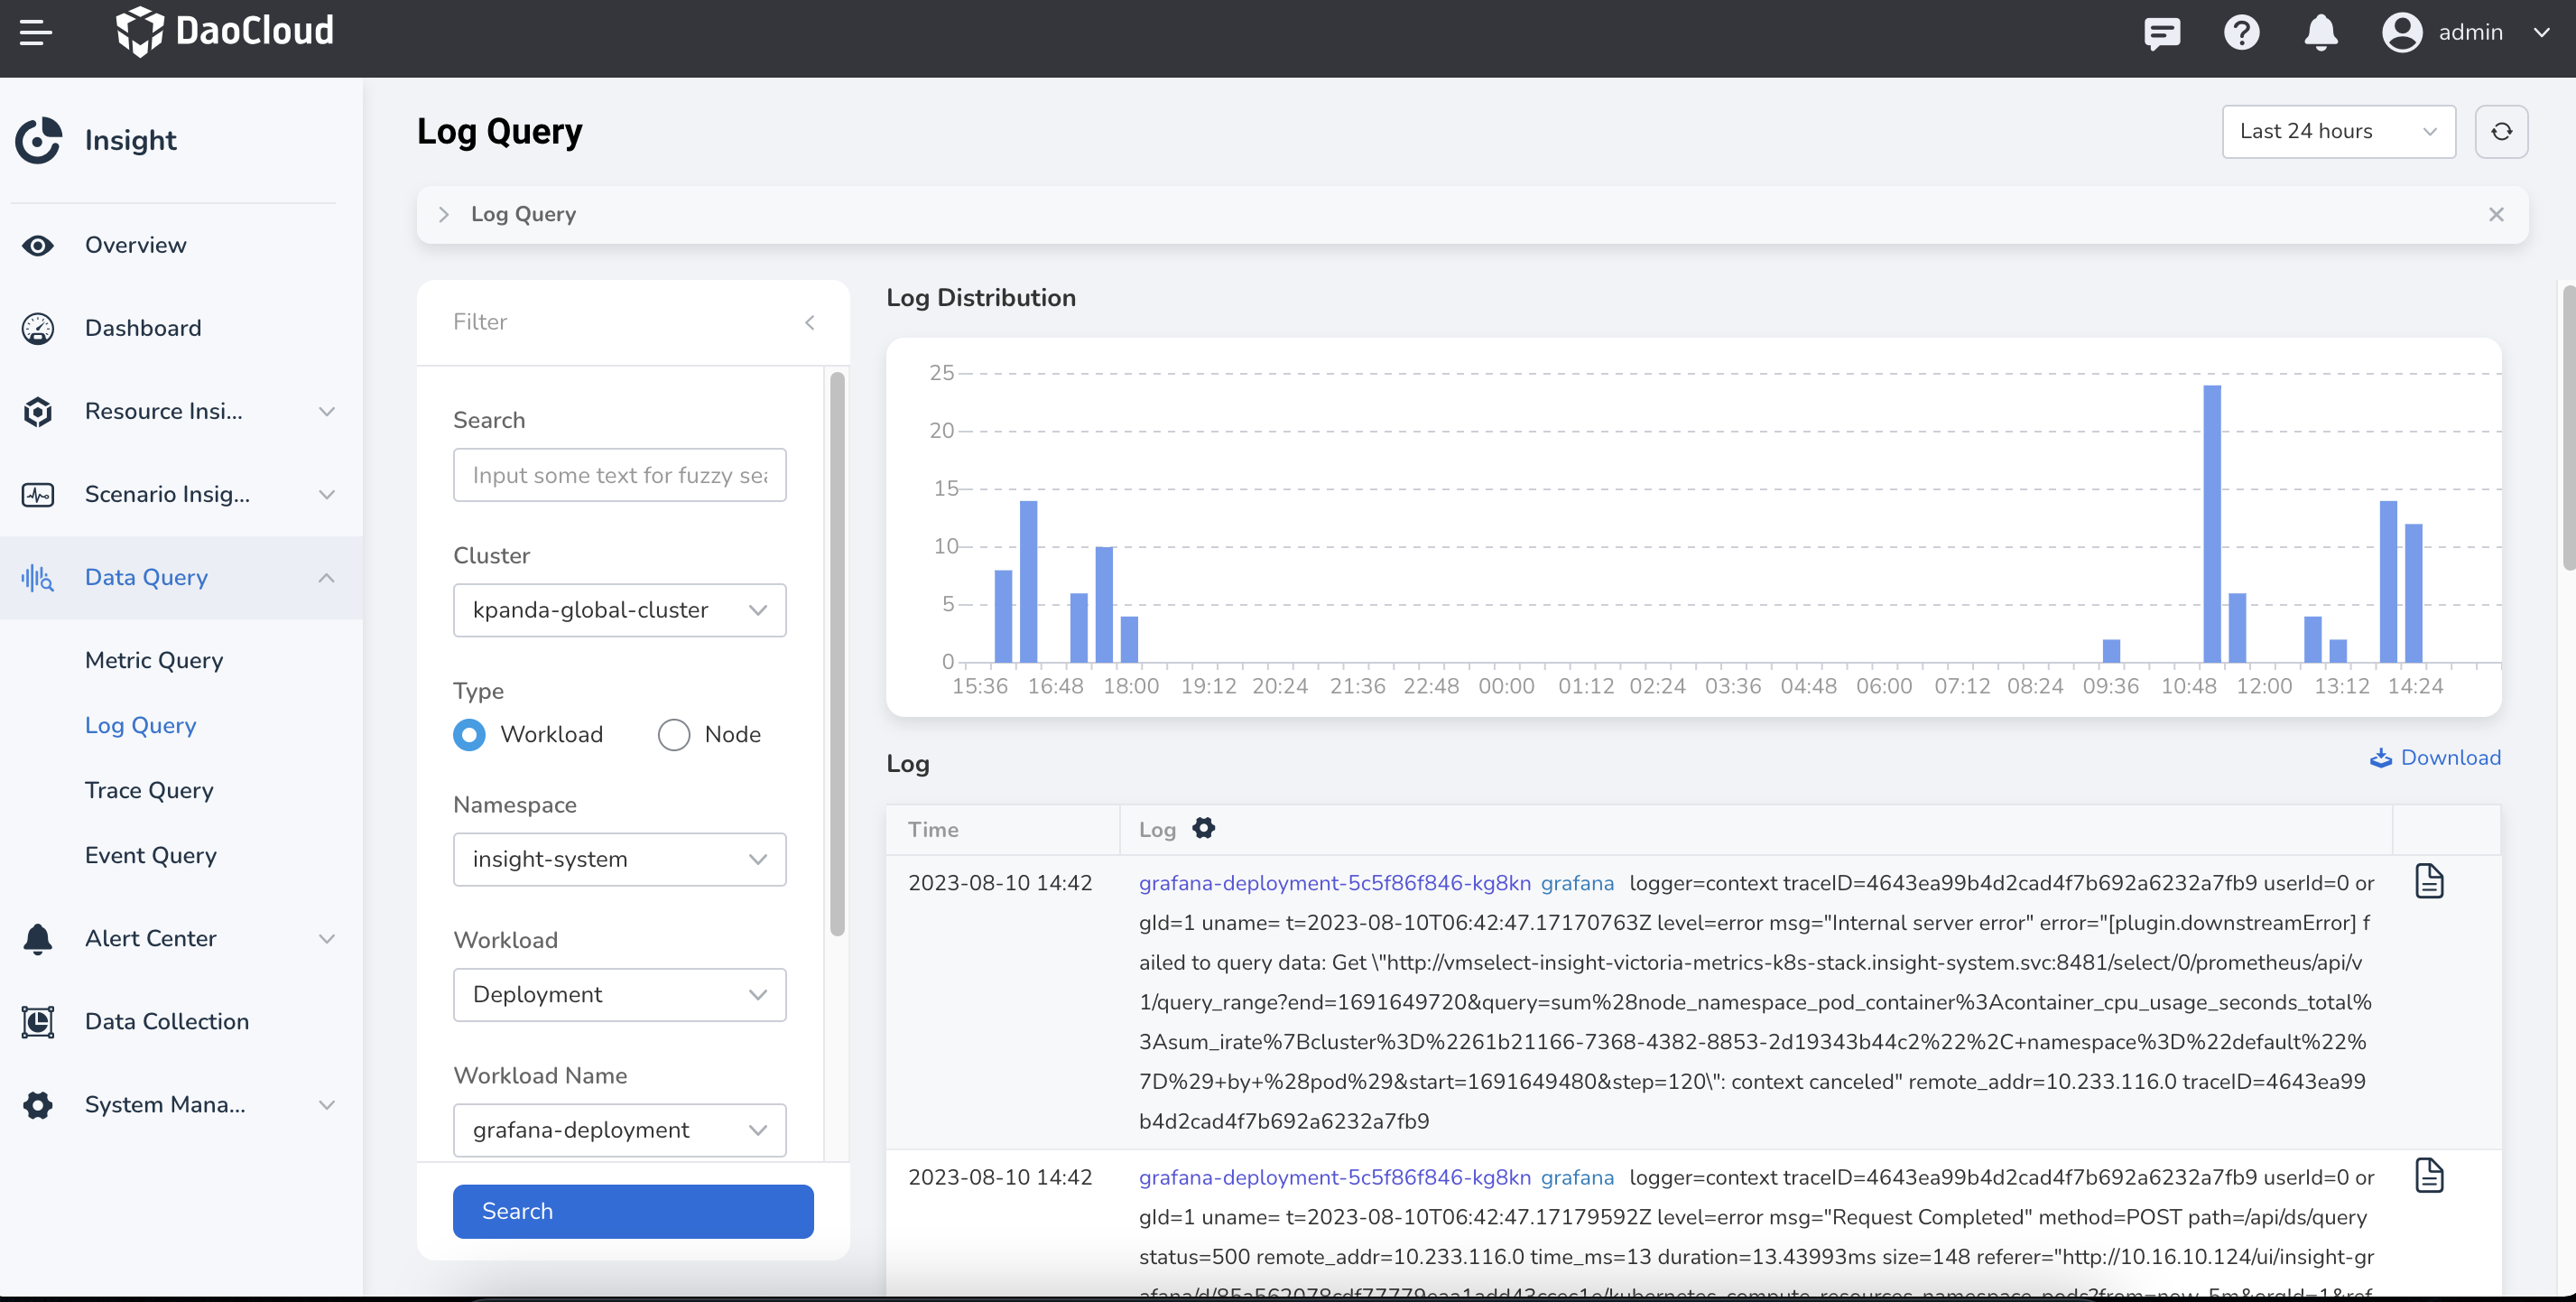
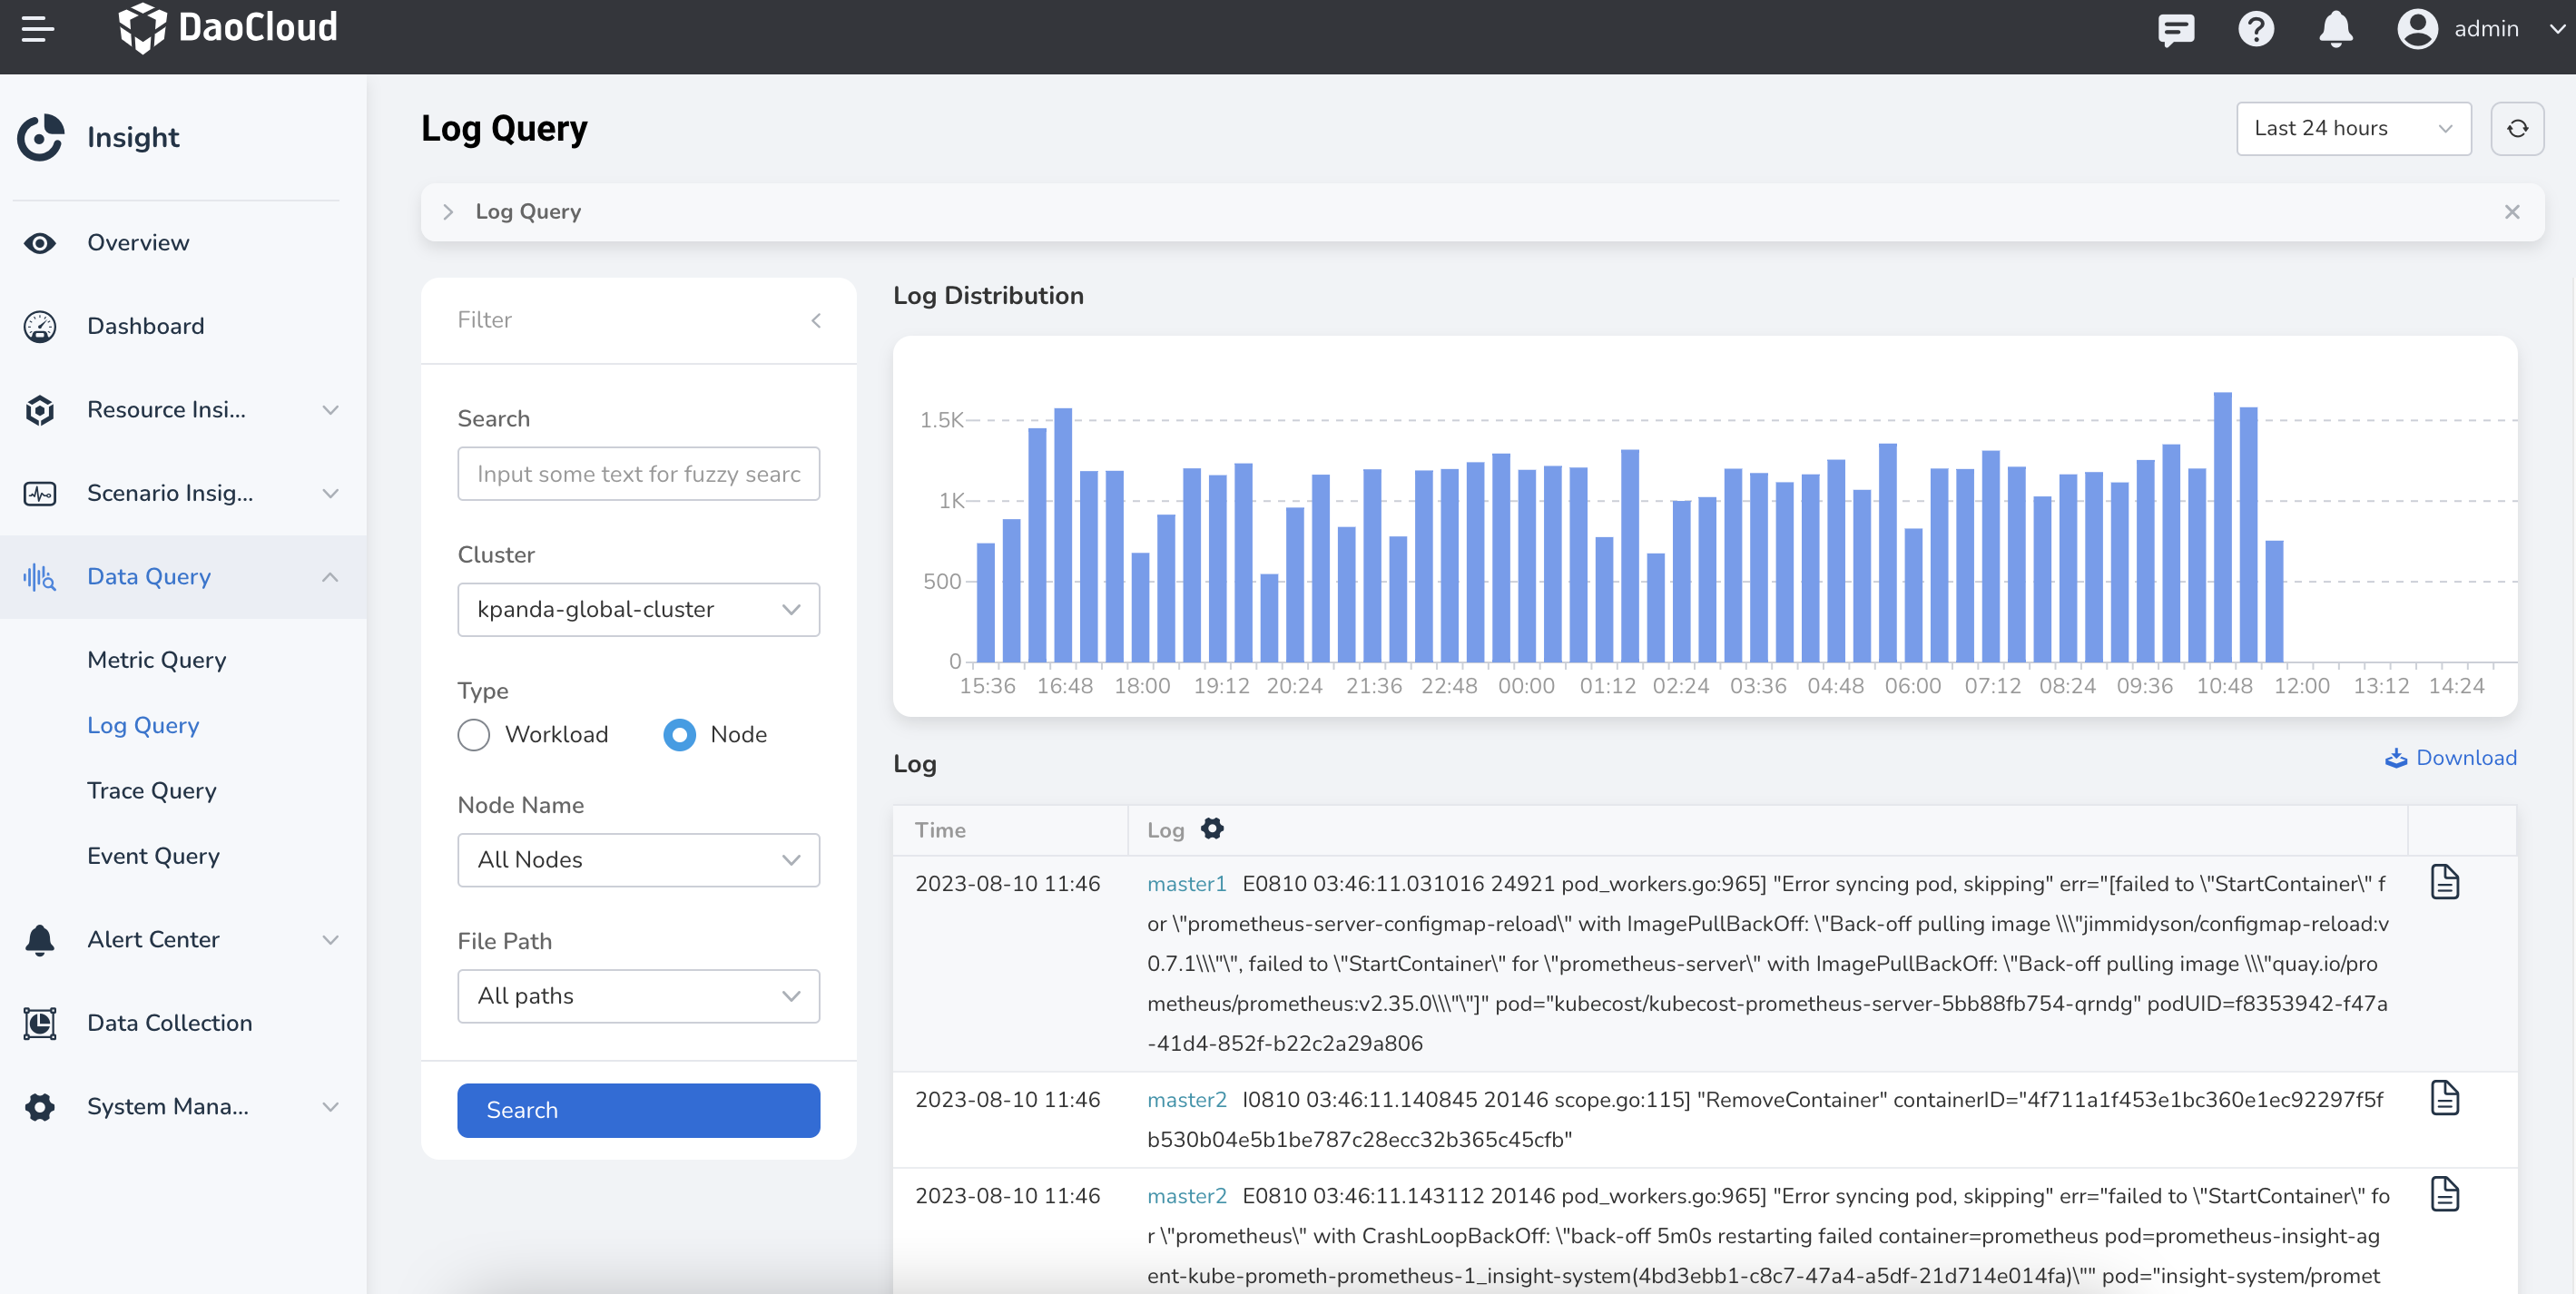
In the left navigation bar, select Data Query -> Log Query .
-
After selecting the query criteria, click Search , and the log records in the form of graphs will be displayed. The most recent logs are displayed on top.
-
In the Filter panel, switch Type and select Node to check the logs of all nodes in the cluster.
-
In the Filter panel, switch Type and select Event to view the logs generated by all Kubernetes events in the cluster.
Lucene Syntax Explanation:
- Use logical operators (AND, OR, NOT, "") to query multiple keywords. For example: keyword1 AND (keyword2 OR keyword3) NOT keyword4.
- Use a tilde (~) for fuzzy queries. You can optionally specify a parameter after the "~" to control the similarity of the fuzzy query. If not specified, it defaults to 0.5. For example: error~.
- Use wildcards (*, ?) as single-character placeholders to match any character.
- Use square brackets [ ] or curly braces { } for range queries. Square brackets [ ] represent a closed interval and include the boundary values. Curly braces { } represent an open interval and exclude the boundary values. Range queries are applicable only to fields that can be sorted, such as numeric fields and date fields. For example
timestamp:[2022-01-01 TO 2022-01-31]. - For more information, please refer to the Lucene Syntax Explanation.
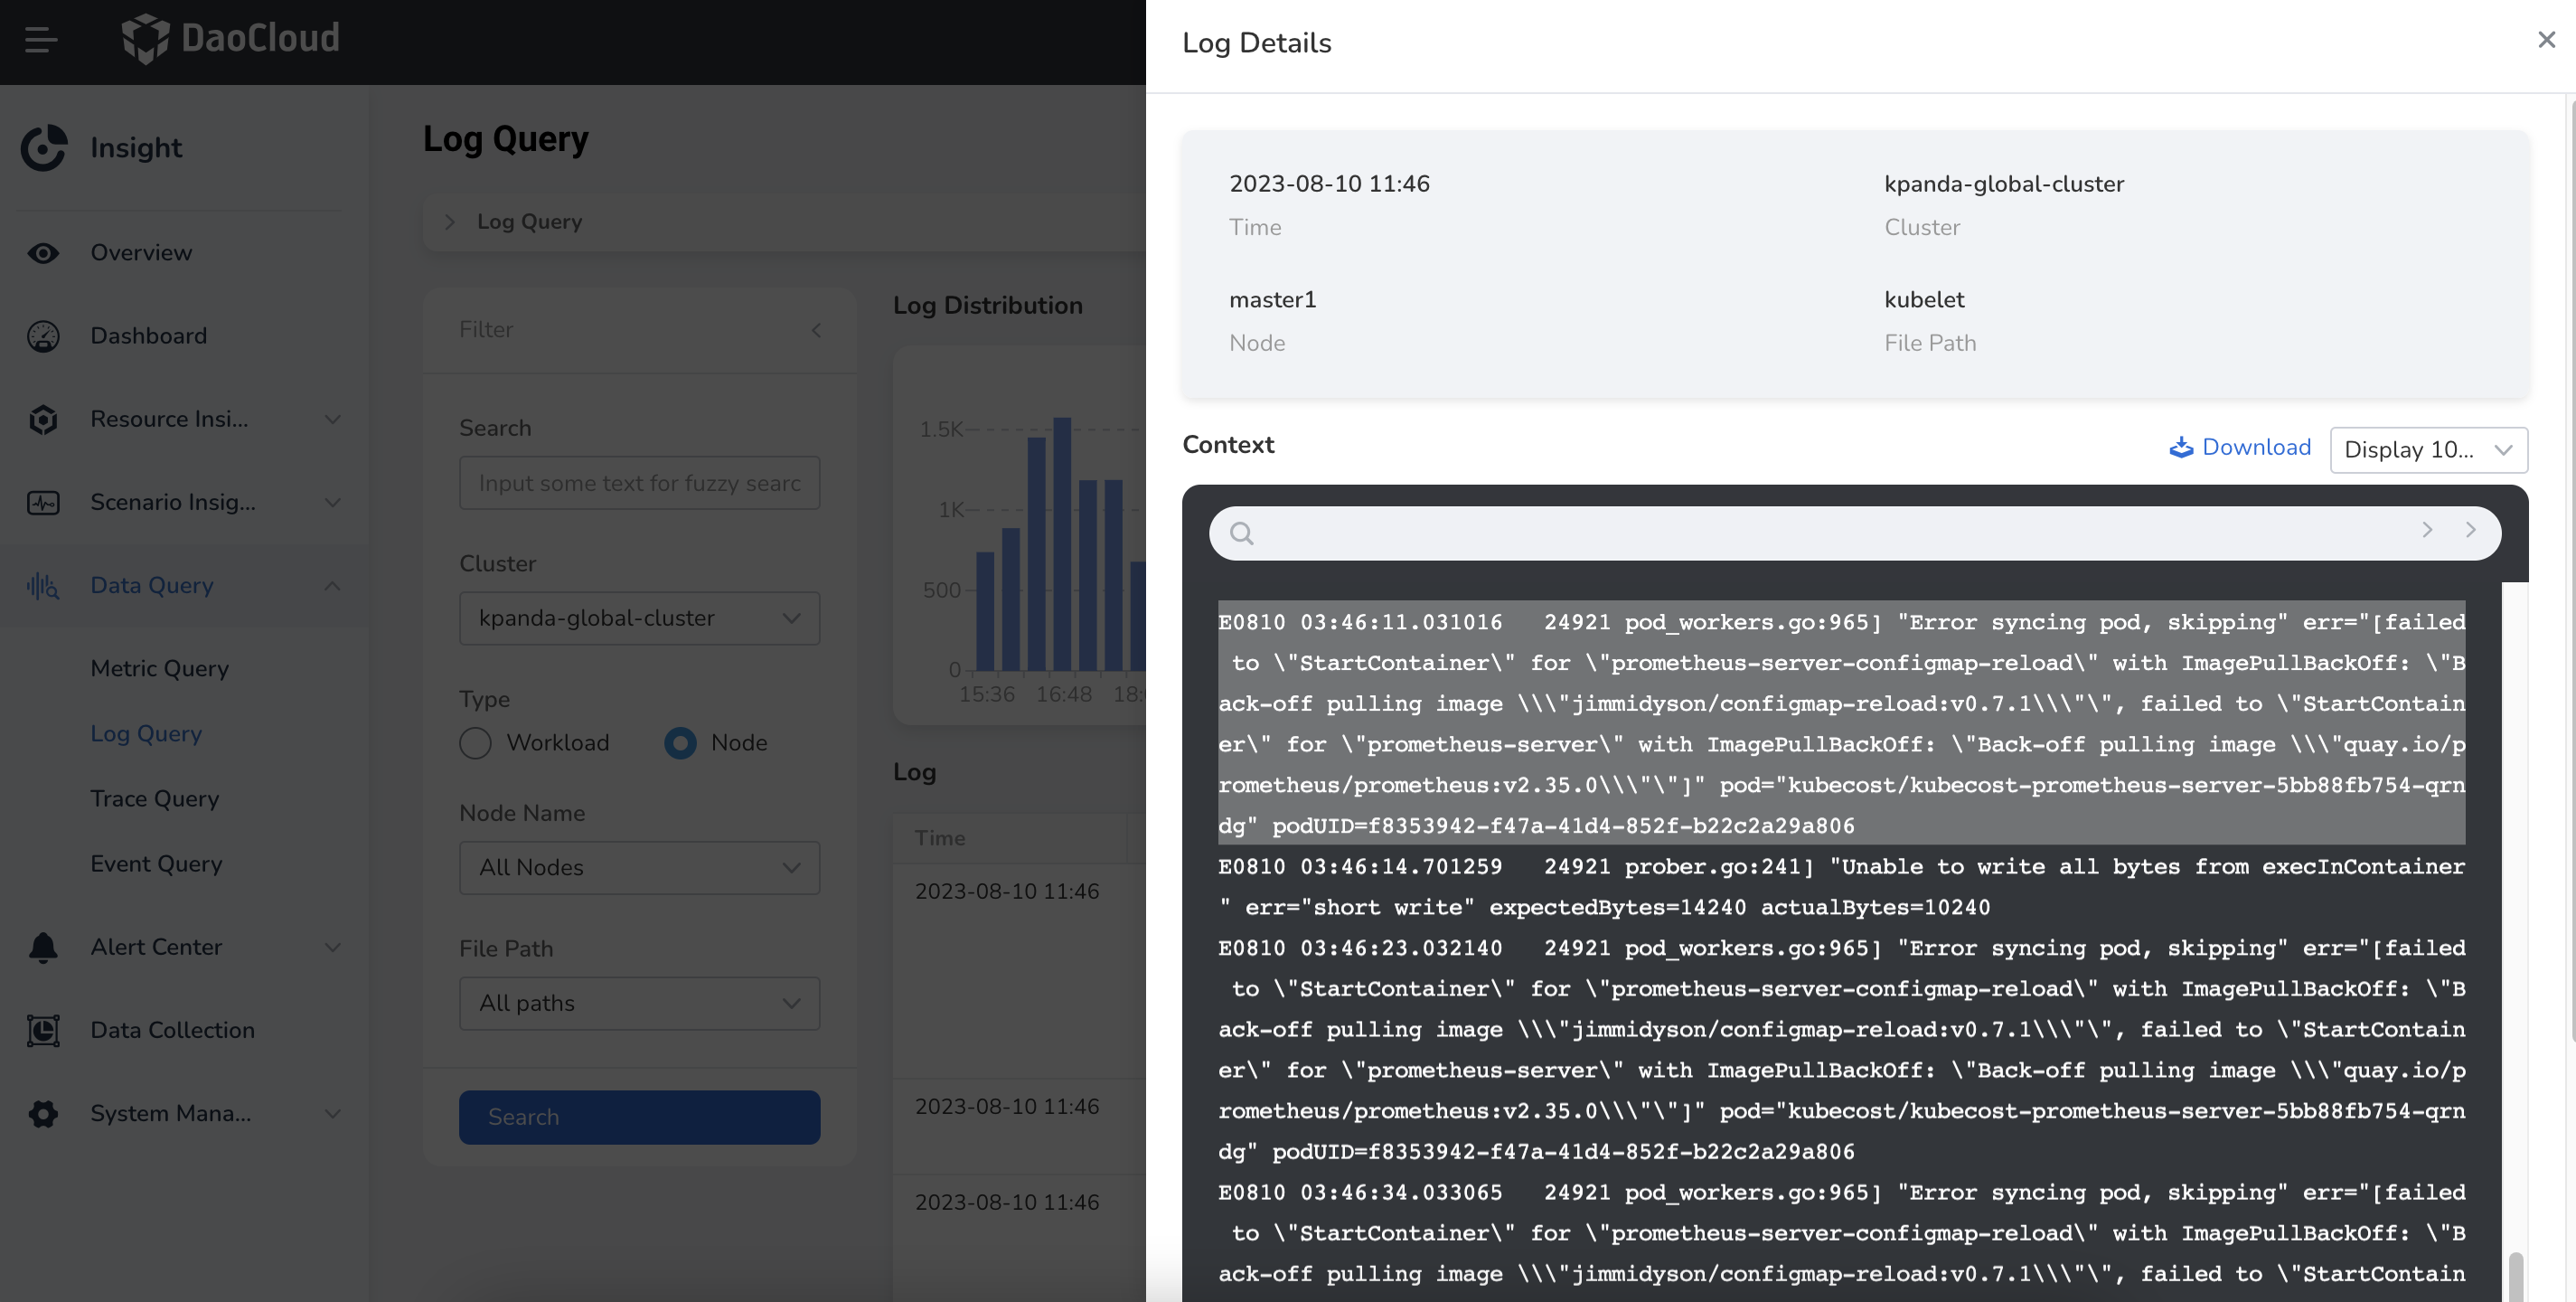
View log context
Clicking on the button next to a log will slide out a panel on the right side where you can view the default 100 lines of context for that log. You can switch the Display Rows option to view more contextual content.
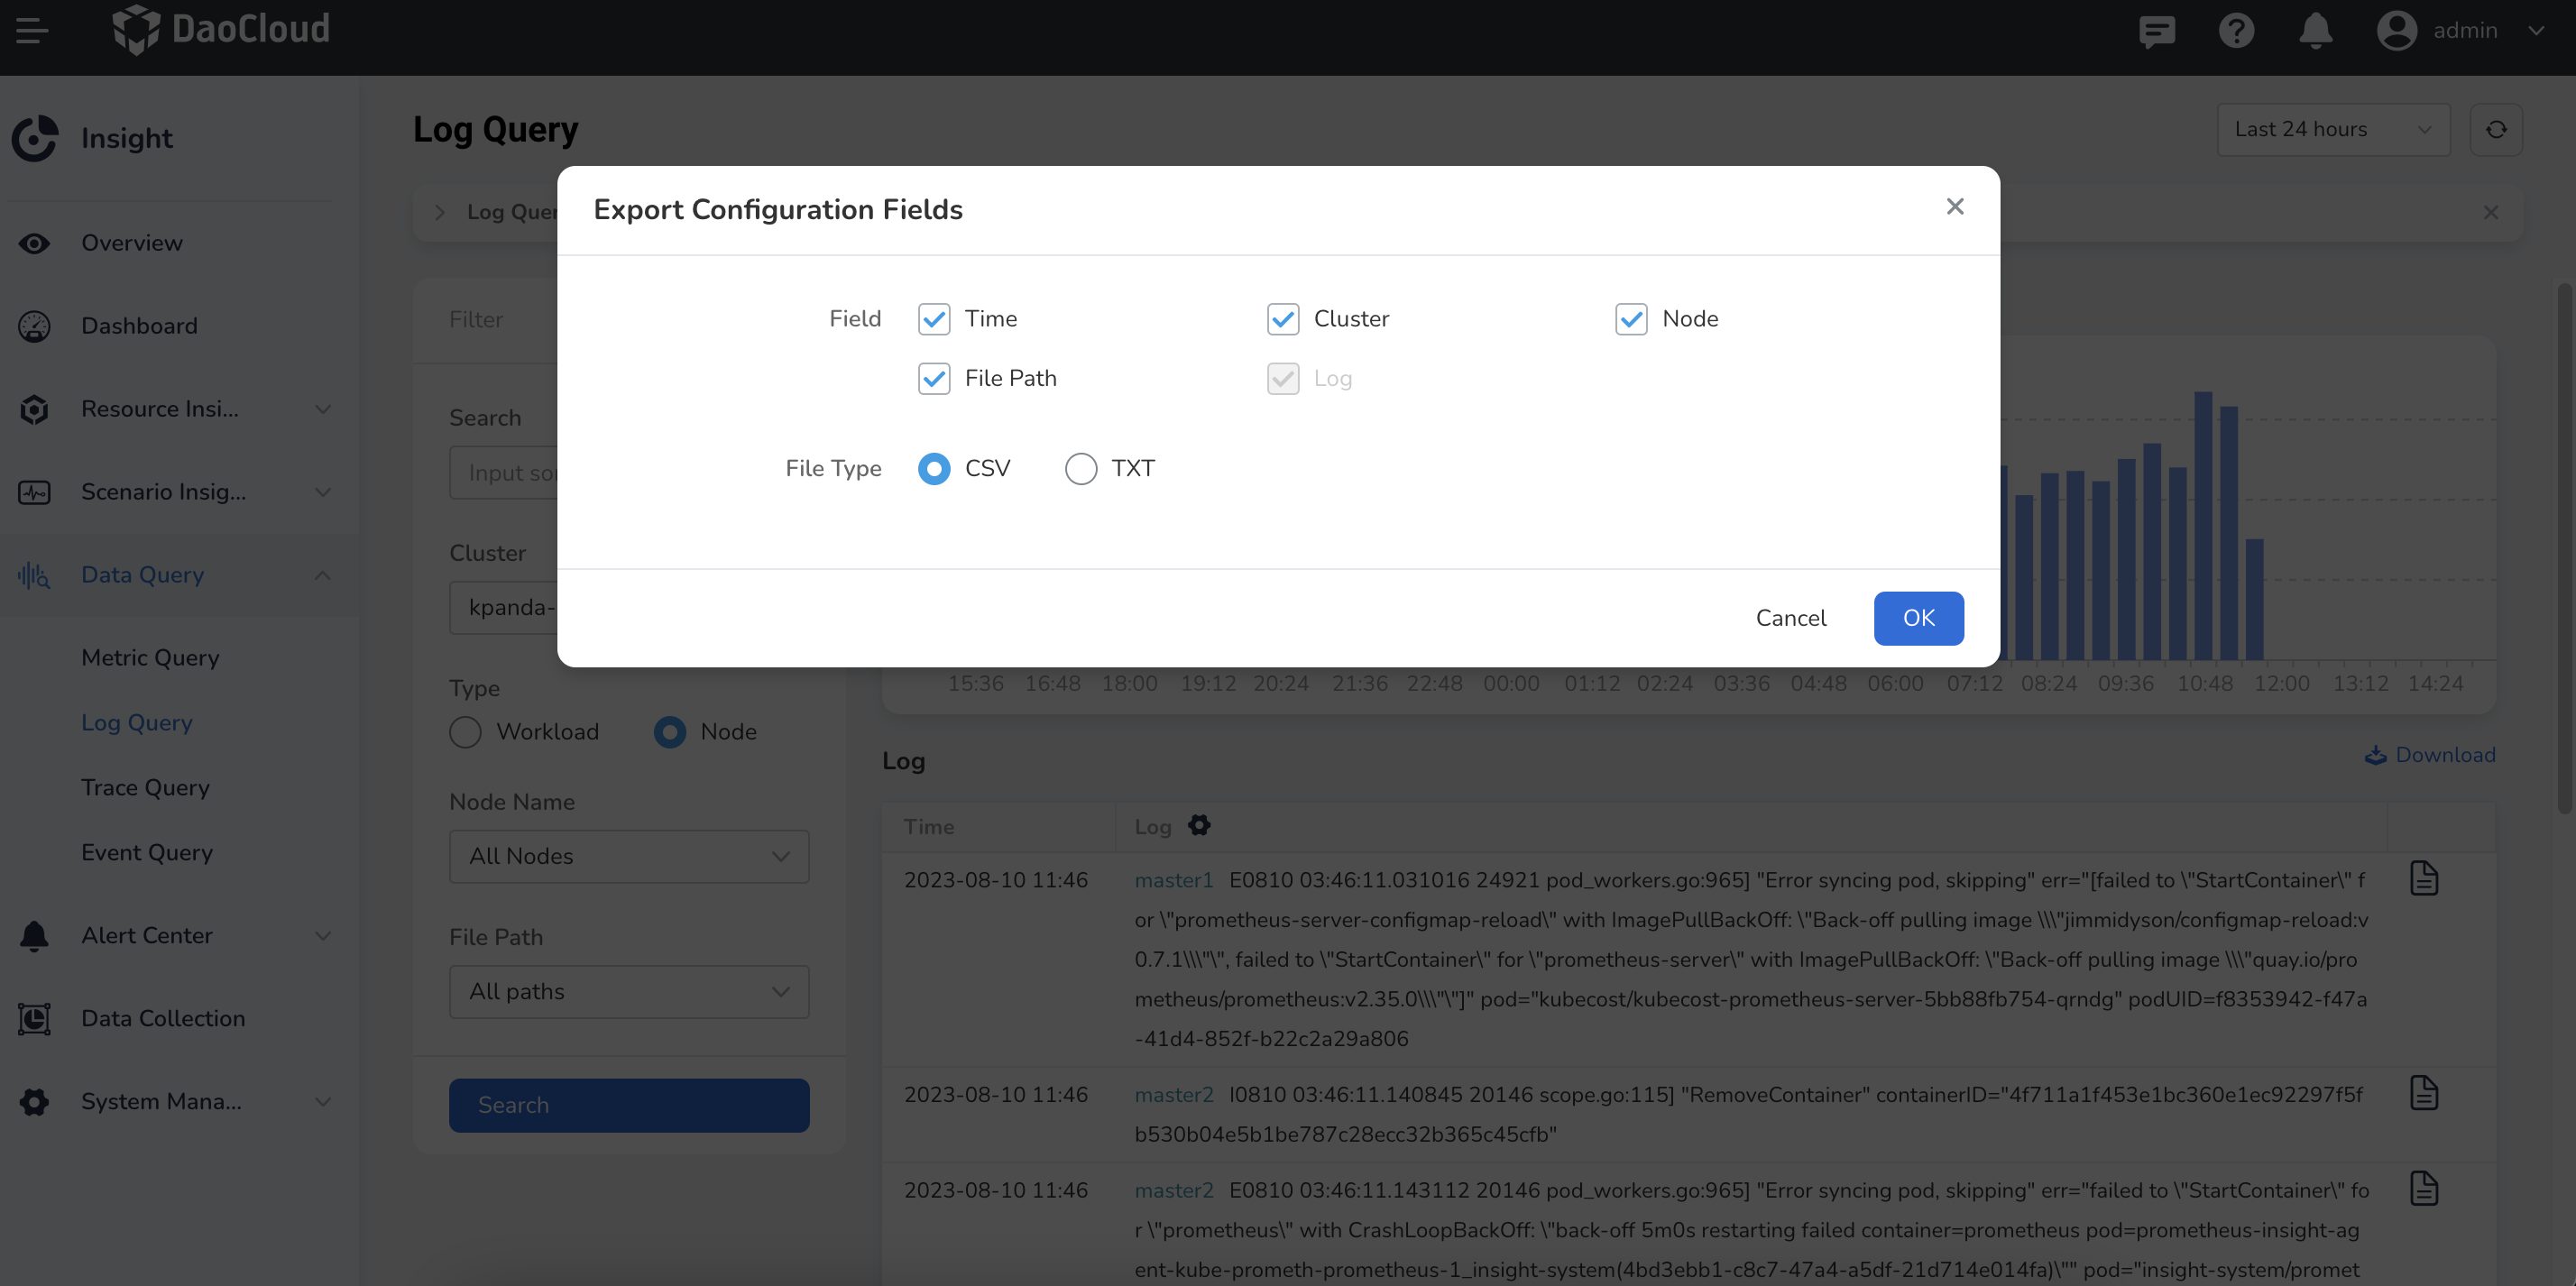
Export log
Click the download button located in the upper right corner of the list.
- You can configure the exported log fields. The available fields may vary depending on the log type, with the Log Content field being mandatory.
- You can export the log query results in .txt or .csv format.