Elasticsearch Troubleshooting Manual
This page will continue to count and sort out common Elasticsearch abnormal faults and repair methods. If you encounter problems in use, please check this troubleshooting manual first.
If you find that the problem you encounter is not included in this manual, you can quickly jump to the bottom of the page and submit your problem.
Elasticsearch PVC disk capacity is full
Storage depends on hwameistor
Error message
{"type": "server", "timestamp": "2022-12-18T10:47:08,573Z", "level": "ERROR", "component": "o.e.m.f.FsHealthService", "cluster.name": " mcamel-common-es-cluster-masters", "node.name": "mcamel-common-es-cluster-masters-es-masters-0", "message": "health check of [/usr/share/elasticsearch /data/nodes/0] failed", "cluster.uuid": "afIglgTVTXmYO2qPFNvsuA", "node.id": "nZRiBCUZQymQVV1son34pA" ,
"stacktrace": ["java.io.IOException: No space left on device",
"at sun.nio.ch.FileDispatcherImpl.write0(Native Method) ~[?:?]",
"at sun.nio.ch.FileDispatcherImpl.write(FileDispatcherImpl.java:62) ~[?:?]",
"at sun.nio.ch.IOUtil.writeFromNativeBuffer(IOUtil.java:132) ~[?:?]",
"at sun.nio.ch.IOUtil.write(IOUtil.java:97) ~[?:?]",
"at sun.nio.ch.IOUtil.write(IOUtil.java:67) ~[?:?]",
"at sun.nio.ch.FileChannelImpl.write(FileChannelImpl.java:285) ~[?:?]",
"at java.nio.channels.Channels.writeFullyImpl(Channels.java:74) ~[?:?]",
"at java.nio.channels.Channels.writeFully(Channels.java:96) ~[?:?]",
"at java.nio.channels.Channels$1.write(Channels.java:171) ~[?:?]",
"at java.io.OutputStream.write(OutputStream.java:127) ~[?:?]",
"at org.elasticsearch.monitor.fs.FsHealthService$FsHealthMonitor.monitorFSHealth(FsHealthService.java:170) [elasticsearch-7.16.3.jar:7.16.3]",
"at org.elasticsearch.monitor.fs.FsHealthService$FsHealthMonitor.run(FsHealthService.java:144) [elasticsearch-7.16.3.jar:7.16.3]",
"at org.elasticsearch.threadpool.Scheduler$ReschedulingRunnable.doRun(Scheduler.java:214) [elasticsearch-7.16.3.jar:7.16.3]",
"at org.elasticsearch.common.util.concurrent.ThreadContext$ContextPreservingAbstractRunnable.doRun(ThreadContext.java:777) [elasticsearch-7.16.3.jar:7.16.3]",
"at org.elasticsearch.common.util.concurrent.AbstractRunnable.run(AbstractRunnable.java:26) [elasticsearch-7.16.3.jar:7.16.3]",
"at java.util.concurrent.ThreadPoolExecutor.runWorker(ThreadPoolExecutor.java:1136) [?:?]",
"at java.util.concurrent.ThreadPoolExecutor$Worker.run(ThreadPoolExecutor.java:635) [?:?]",
"at java.lang.Thread.run(Thread.java:833) [?:?]"] }
Solution
-
Expansion of PVC (modified from 1Gi to 10Gi)
-
PVC expansion log
View elasticsearch-data-mcamel-common-es-cluster-masters-es-masters-0 expansion log information.
```none Name: elasticsearch-data-mcamel-common-es-cluster-masters-es-masters-0 Namespace: mcamel-system StorageClass: hwameistor-storage-lvm-hdd Status: Bound Volume: pvc-42309e19-b74f-45b4-9284-9c68b7dd93b3 Labels: common.k8s.elastic.co/type=elasticsearch elasticsearch.k8s.elastic.co/cluster-name=mcamel-common-es-cluster-masters elasticsearch.k8s.elastic.co/statefulset-name=mcamel-common-es-cluster-masters-es-masters Annotations: pv.kubernetes.io/bind-completed: yes pv.kubernetes.io/bound-by-controller: yes volume.beta.kubernetes.io/storage-provisioner:lvm.hwameistor.io volume.kubernetes.io/selected-node: xulongju-worker03 Finalizers: [kubernetes.io/pvc-protection] Capacity: 10Gi Access Modes: RWO VolumeMode: Filesystem Used By: mcamel-common-es-cluster-masters-es-masters-0 Events: Type Reason Age From Messagekubectl describe pvc elasticsearch-data-mcamel-common-es-cluster-masters-es-masters-0 -n mcamel-system
Normal WaitForPodScheduled 51m (x18 over 55m) persistent volume-controller waiting for pod mcamel-common-es-cluster-masters-es-masters-0 to be scheduled Normal WaitForFirstConsumer 50m (x7 over 56m) persistent volume-controller waiting for first consumer to be created before binding Normal External Provisioning 50m persistent volume-controller waiting for a volume to be created, either by external provisioner "lvm.hwameistor.io" or manually created by system administrator Normal Provisioning 50mlvm.hwameistor.io_hwameistor-local-storage-csi-controller-68c9df8db8-kzdgn_680380b5-fc4d-4b82-ba80-5681e99a8711 External provisioner is provisioning volume for claim "mcamel-system/elasticsearch-data-mcamel-common-es-cluster-masters-es-masters-0" Normal ProvisioningSucceeded 50m lvm.hwameistor.io_hwameistor-local-storage-csi-controller-68c9df8db8-kzdgn_680380b5-fc4d-4b82-ba80-5681e99a8711 Successfully provisioned volume pvc-42309e19-b74f-45b4-9284-9c68b7dd93b3 Warning ExternalExpanding 3m39s volume_expand Ignoring the PVC: didn't find a plugin capable of expanding the volume; waiting for an external controller to process this PVC. Warning VolumeResizeFailed 3m39s external-resizer lvm.hwameistor.io resize volume "pvc-42309e19-b74f-45b4-9284-9c68b7dd93b3" by resizer "lvm.hwameistor.io" failed: rpc error: code = Unknown desc = volume expansion not completed yet Warning VolumeResizeFailed 3m39s external-resizer lvm.hwameistor.io resize volume "pvc-42309e19-b74f-45b4-9284-9c68b7dd93b3" by resizer "lvm.hwameistor.io" failed: rpc error: code = Unknown desc = volume expansion in progress Normal Resizing 3m38s (x3 over 3m39s) external-resizer lvm.hwameistor.io External resizer is resizing volume pvc-42309e19-b74f-45b4-9284-9c68b7dd93b3 Normal FileSystemResizeRequired 3m38s external-resizer lvm.hwameistor.io Require file system resize of volume on node Normal FileSystemResizeSuccessful 2m42s kubelet
```
Elasticsearch business index alias is occupied
Phenomenon: index alias is occupied
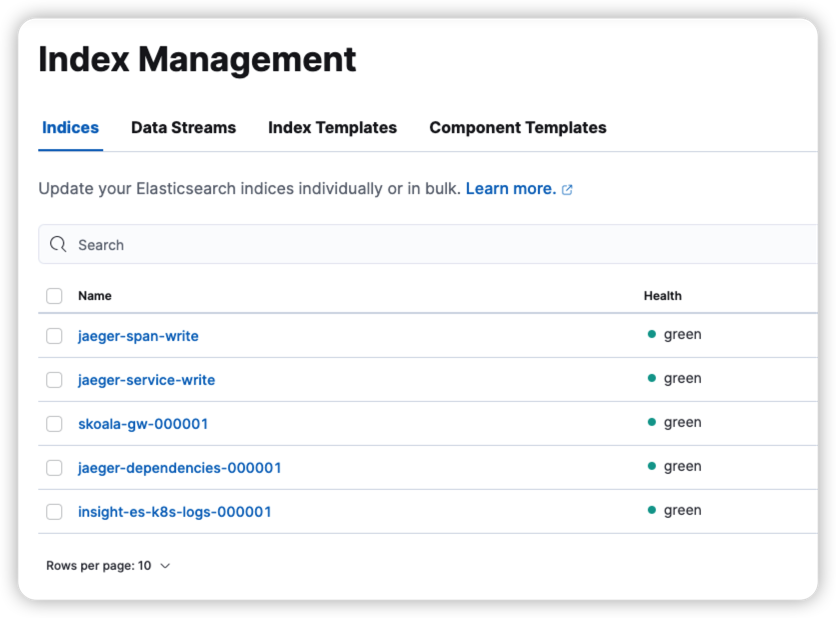
*-write in this figure is an alias, such as jaeger-span-write , which needs to be processed
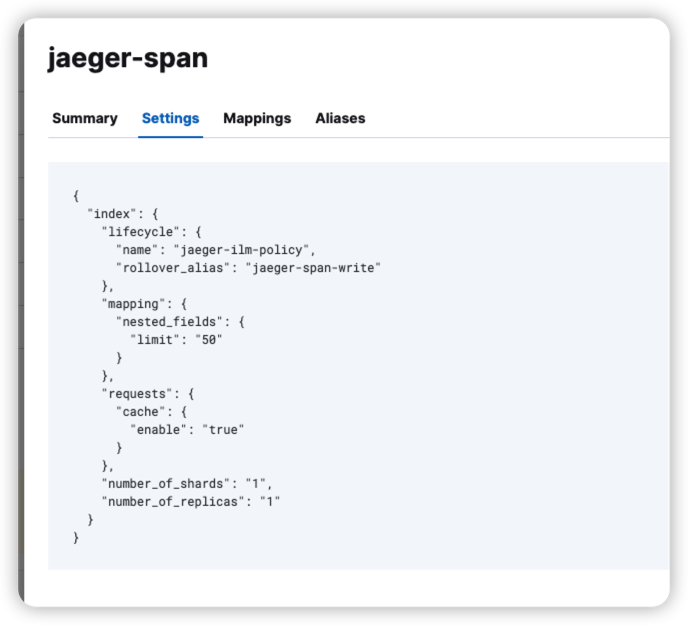
View the alias rollover_alias corresponding value used in the business index template
Temporary processing method: enter the es pod container and run the following script:
-
Modify the corresponding value of TEMPLATE_NAME
-
Modify the corresponding value of INDEX_ALIAS
-
You need to enter the elasticsearch pod to run the script
-
Modify the password value of the elastic user inside (ES_PASSWORD=xxxx)
#!/bin/bash
# Add a template/policy/index
TEMPLATE_NAME=insight-es-k8s-logs
INDEX_ALIAS="${TEMPLATE_NAME}-alias"
ES_PASSWORD="DaoCloud"
ES_URL=https://localhost:9200
while [[ "$(curl -s -o /dev/null -w '%{http_code}\n' -u elastic:${ES_PASSWORD} $ES_URL -k)" != "200" ]]; do sleep 1 ; done
curl -XDELETE -u elastic:${ES_PASSWORD} -k "$ES_URL/${INDEX_ALIAS}"
curl -XPUT -u elastic:${ES_PASSWORD} -k "$ES_URL/${TEMPLATE_NAME}-000001" -H 'Content-Type: application/json' -d'{"aliases": {'\""${ INDEX_ALIAS}"\"':{"is_write_index": true }}}'
Note: This script has a certain chance of failure, depending on the data writing speed, as a temporary solution.
In the real situation, it is necessary to stop the writing of the data source, and then run the above method.
Error reporting Error setting GoMAXPROCS for operator
error message
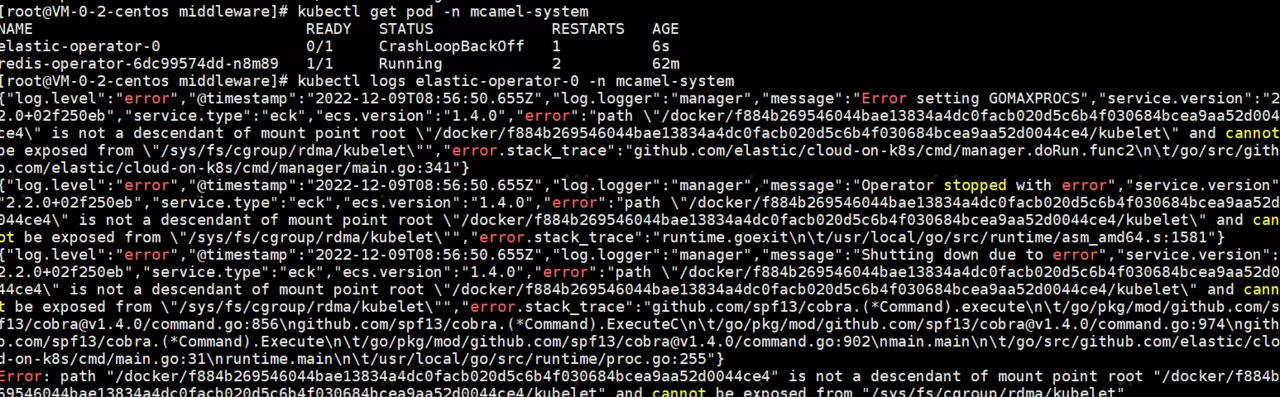
Environmental information:
Solution
Upgrade your version:
Error Terminating due to java.lang.OutOfMemoryError: Java heap space
The complete error message is as follows:
{"type": "server", "timestamp": "2023-01-04T14:44:05,920Z", "level": "WARN", "component": "o.e.d.PeerFinder", "cluster.name": "gsc-cluster-1-master-es", "node.name": "gsc-cluster-1-master-es-es-data-0", "message": "address [127.0.0.1:9305], node [null], requesting [false] connection failed: [][127.0.0.1:9305] connect_exception: Connection refused: /127.0.0.1:9305: Connection refused", "cluster.uuid": "JOa0U_Q6T7WT60SPYiR1Ig", "node.id": "_zlorWVeRbyrUMYf9wJgfQ"  }
{"type": "server", "timestamp": "2023-01-04T14:44:06,379Z", "level": "WARN", "component": "o.e.m.j.JvmGcMonitorService", "cluster.name": "gsc-cluster-1-master-es", "node.name": "gsc-cluster-1-master-es-es-data-0", "message": "[gc][15375] overhead, spent [1.3s] collecting in the last [1.3s]", "cluster.uuid": "JOa0U_Q6T7WT60SPYiR1Ig", "node.id": "_zlorWVeRbyrUMYf9wJgfQ"  }
{"timestamp": "2023-01-04T14:44:06+00:00", "message": "readiness probe failed", "curl_rc": "28"}
java.lang.OutOfMemoryError: Java heap space
Dumping heap to data/java_pid7.hprof ...
{"timestamp": "2023-01-04T14:44:11+00:00", "message": "readiness probe failed", "curl_rc": "28"}
{"timestamp": "2023-01-04T14:44:14+00:00", "message": "readiness probe failed", "curl_rc": "28"}
{"timestamp": "2023-01-04T14:44:17+00:00", "message": "readiness probe failed", "curl_rc": "28"}
{"timestamp": "2023-01-04T14:44:21+00:00", "message": "readiness probe failed", "curl_rc": "28"}
{"timestamp": "2023-01-04T14:44:26+00:00", "message": "readiness probe failed", "curl_rc": "28"}
{"timestamp": "2023-01-04T14:44:31+00:00", "message": "readiness probe failed", "curl_rc": "28"}
Heap dump file created [737115702 bytes in 25.240 secs]
Terminating due to java.lang.OutOfMemoryError: Java heap space
Solution
If conditions permit, resource and capacity planning can be carried out.
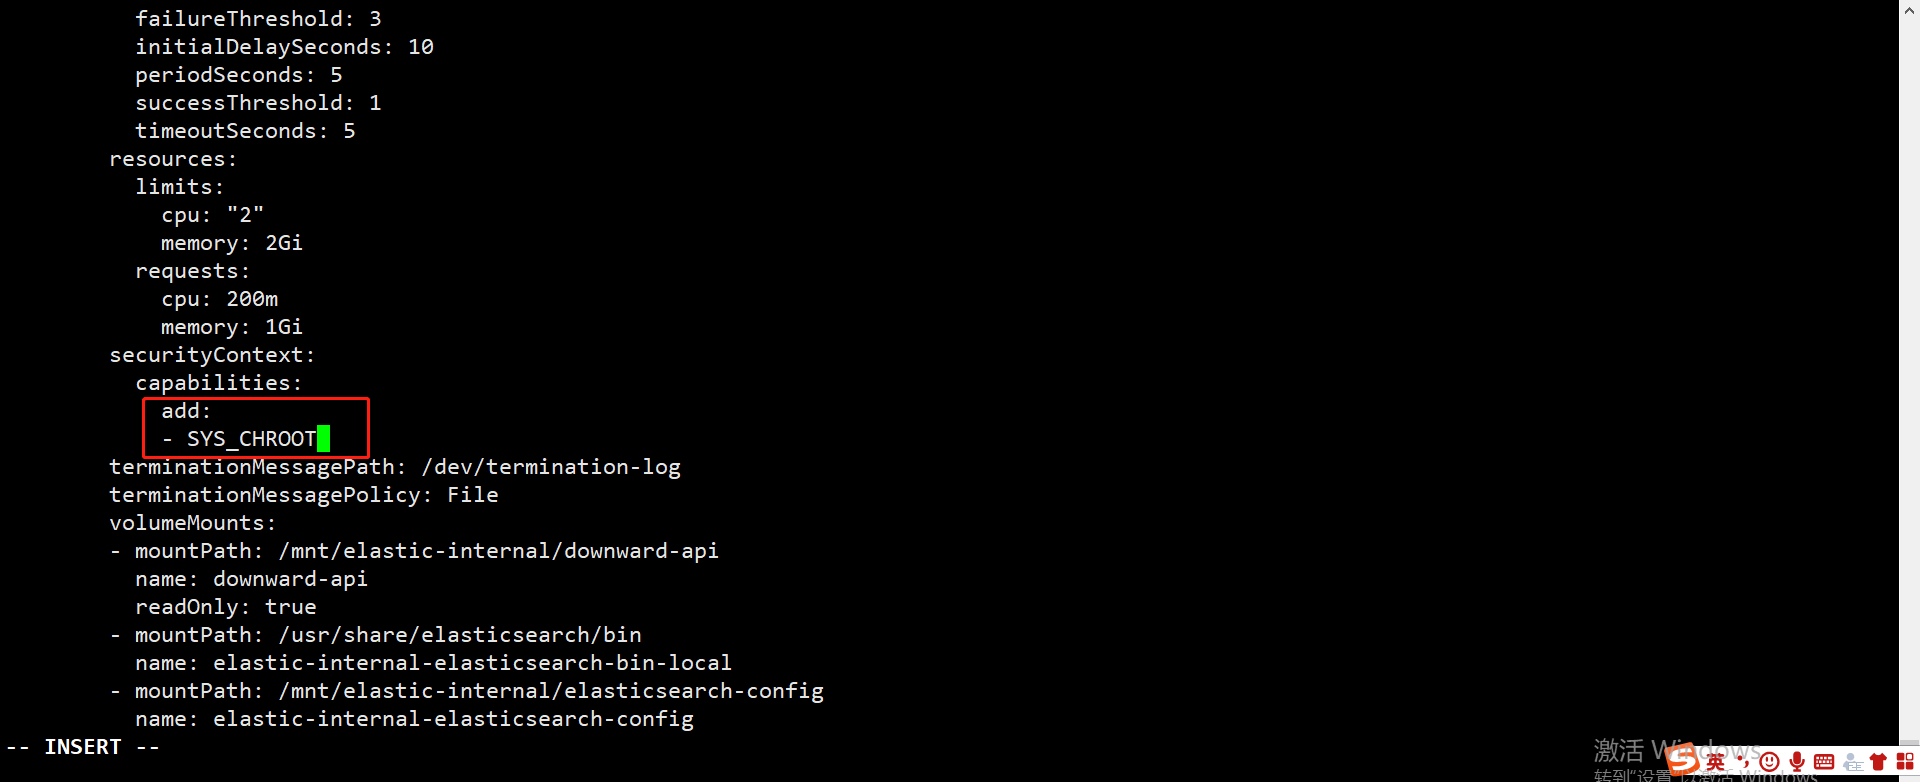
OCP environment installation Elasticsearch reports an error Operation not permitted
error message

Solution
The disk read throughput of a certain node is abnormal, and the CPU workload is very high
Exceptions
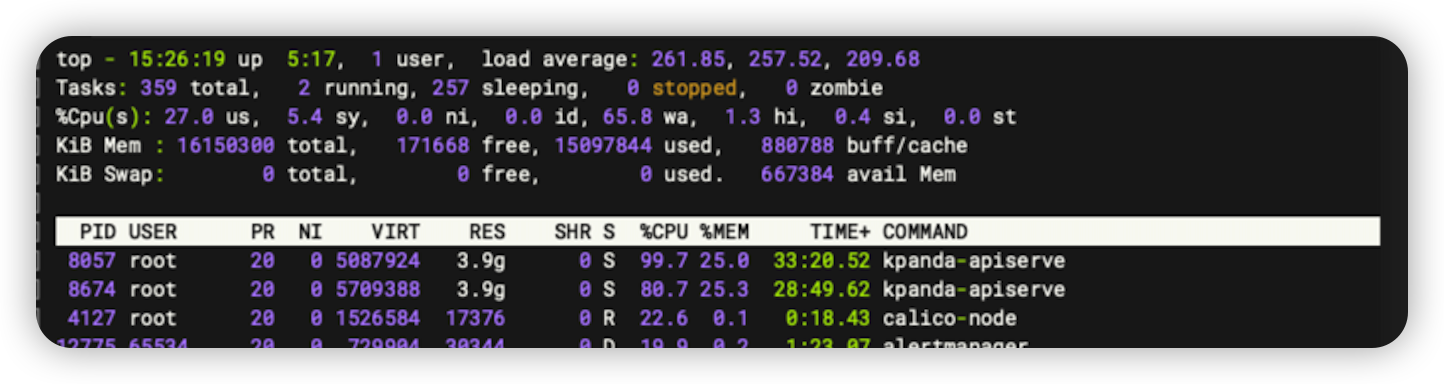
Solution
If es is on this node, the ES process can be killed and restored.
Error reporting status:429 when data is written to Elasticsearch
The complete error message is as follows:
[2023/03/23 09:47:16] [error] [output:es:es.kube.kubeevent.syslog] error: Output
{"took":0,"errors":true,"items":[{"create":{"_index":"insight-es-k8s-logs-000067","_type":"_doc","_id ":"MhomDIcBLVS7yRloG6PF","status":429,"error":{"type":"es_rejected_execution_exception","reason":"rejected execution of org.elasticsearch.action.support.replication.TransportWriteAction$1/WrappedActionListener{org. elasticsearch.action.support.replication.ReplicationOperation$$Lambda$7002/0x0000000801b2b3d0@16e9faf7}{org.elasticsearch.action.support.replication.ReplicationOperation$$Lambda$7003/0x0000000801b2b5f8@46 bcb787} on EsThreadPoolExecutor[name = mcamel-common-es- cluster-masters-es-data-0/write, queue capacity = 10000, org.elasticsearch.common.util.concurrent.EsThreadPoolExecutor@499b0f50[Running, pool size = 2, active threads = 2, queued tasks = 10000, completed tasks = 11472149]]"}}},{"create":{"_index":"insight-es-k8s-logs-000067","_type":"_doc","_id":"MxomDIcBLVS7yRloG6PF","status" :429,"error":{"type":"es_rejected_execution_exception","reason":"rejected execution of org.elasticsearch.action.support.replication.TransportWriteAction$1/WrappedActionListener{org.elasticsearch.action.support.replication.ReplicationOperation $$Lambda$7002/0x0000000801b2b3d0@16e9faf7}{org.elasticsearch.action.support.replication.ReplicationOperation$$Lambda$7003/0x0000000801b2b5f8@46bcb787} on EsThreadPoolExecutor[name = mcamel -common-es-cluster-masters-es-data-0 /write, queue capacity = 10000, org.elasticsearch.common.util.concurrent.EsThreadPoolExecutor@499b0f50[Running, pool size = 2, active threads = 2, queued tasks = 10000, completed tasks = 11472149]]"}} }, {"create":{"_index":"insight-es-k8s-logs-000067","_type":"_doc","_id":"NBomDIcBLVS7yRloG6PF","status":429,"error":{" type":"es_rejected_execution_exception","reason":"rejected execution of org.elasticsearch.action.support.replication.TransportWriteAction$1/WrappedActionListener{org.elasticsearch.action.support.replication.ReplicationOperation$$Lambda$7002/0x000000 0801b2b3d0@16e9faf7} {org.elasticsearch.action.support.replication.ReplicationOperation$$Lambda$7003/0x0000000801b2b5f8@46bcb787} on EsThreadPoolExecutor[name = mcamel-common-es-cluster-masters-es-data-0/write, queue capacity = 10000 , org .elasticsearch.common.util.concurrent.EsThreadPoolExecutor@499b0f50[Running, pool size = 2, active threads = 2, queued tasks = 10000, completed tasks = 11472149]]"}}}]}
Solution
-
Method 1: The reason for the 429 error is that the writing concurrency of Elasticsearch is too large, and Elasticsearch is too late to deal with it. You can properly reduce the writing concurrency and control the amount of writing.
-
Method 2: If resources permit, the queue size can be appropriately increased
Method 1 and method 2 can be used together.