Monitoring Alert
The microservice gateway uses the built-in Grafana dashboard to monitor resource usage of the gateway, monitoring details from Envoy, service monitoring details, and resource running information such as APIServe, and HTTPProxy.
To view monitoring alerts, perform the following steps:
-
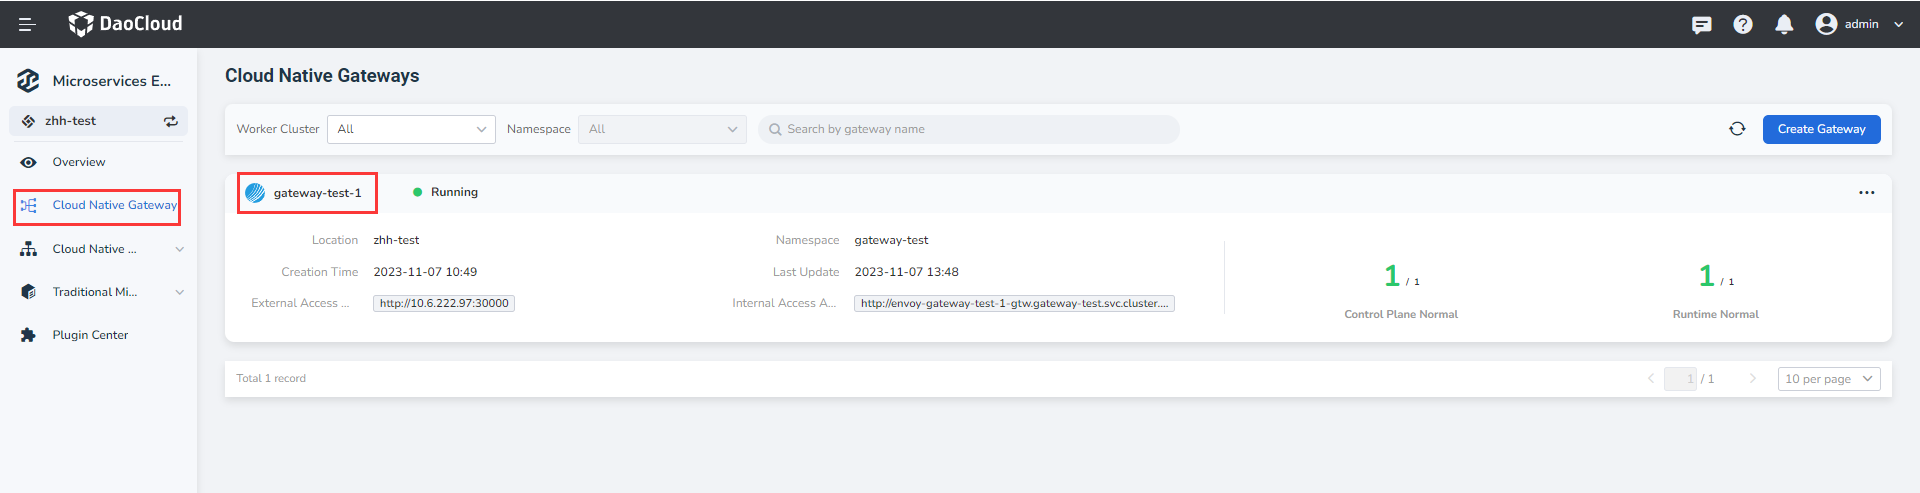
Enter the microservice engine module, click the microservice gateway in the left navigation bar, and click the name of the target gateway.
-
On the left navigation bar, click Monitoring & Alert , and click the Data Planel tab to view service monitoring information.
You can select the monitoring time window and refresh period in the upper right corner of the page.
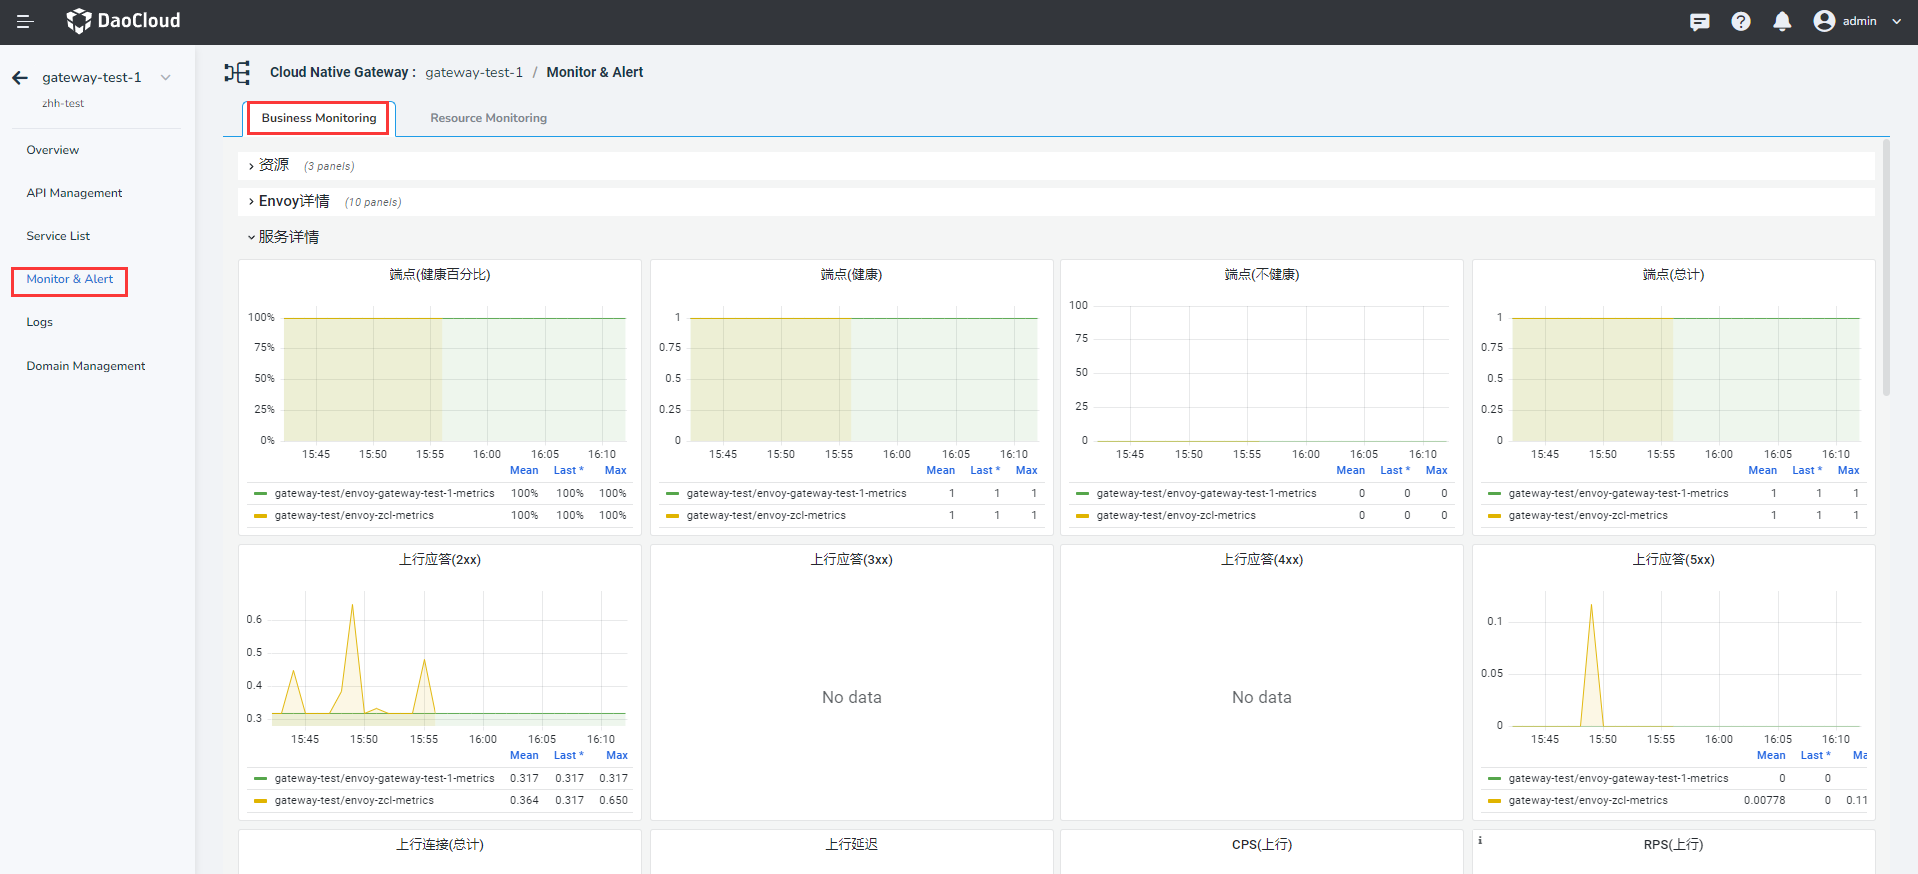
Items Description CPU utilization This is used to monitor the CPU utilization of Pods in a Kubernetes cluster. Memory utilization This is used to monitor the Memory utilization of Pods in a Kubernetes cluster. Data reception This is used to monitor the number of network bytes received by Pods in a Kubernetes cluster. Envoy Connection (Open) It is used to record the number of active connections downstream of HTTP/HTTPS (i.e. clients) that are connected to the Envoy proxy, including the number of connections that are processing requests or remain open. Envoy(Heap memory) This is used to record the size of the memory heap used by the Envoy proxy server, which is the portion of memory used for dynamically allocated storage of objects, data structures, and other runtime data. Envoy(Allocated Memory) This is used to record the amount of memory currently allocated by the Envoy proxy server, which represents the actual amount of physical memory used by the Envoy during its operation. Monitor (Active) Records the number of currently active listeners in the Envoy proxy, which are used to receive and process incoming network connection requests. They define the proxy's network entry points and configuration. Monitor (Warming) This is used to record the number of listeners in the Envoy proxy that are currently being started or warmed up, the initialization and preparation phase required before listeners can accept and process incoming network connections. Monitor (Draining) This is used to record the number of listeners in the Envoy proxy that are currently emptying, which is the process of waiting for all existing connections to close before stopping accepting new connections. This is often a policy when performing smooth upgrades, maintenance, or stopping agents to ensure that established connections end properly. Downstream connections (total) It is used to record the number of active connections downstream of HTTP/HTTPS (i.e. clients) that are connected to the Envoy proxy, including the number of connections that are processing requests or remain open. Downlink delay It divides the requests into buckets according to the processing time. Each bucket indicates the number of requests in a time range. RPS(Downlink) Record the total number of HTTP downstream requests received by the Envoy agent. CPS(down) This is used to record the total number of HTTP downstream (i.e., clients) connections connected to the Envoy proxy. Endpoint (health percentage) This is used to record the percentage of the health status of cluster members, which are typically instances or nodes of upstream or back-end services to which the agent is connected. Endpoint (health) It is used to record the health status of cluster members, which are typically instances or nodes of upstream or back-end services to which the agent is connected. Endpoints (unhealthy) It is used to record the unhealthy status of cluster members, which are typically instances or nodes of upstream or back-end services to which the agent is connected. Endpoints (total) It is used to record the number of cluster members, which are usually instances or nodes of upstream or back-end services to which the agent is connected. Uplink response (2xx) Represents the number of requests sent from the Envoy agent to the upstream cluster with status code 2xx. Uplink response (3xx) Represents the number of requests sent from the Envoy agent to the upstream cluster with status code 3xx. Uplink response (4xx) Represents the number of requests sent from the Envoy agent to the upstream cluster with status code 4xx. Uplink response (5xx) Represents the number of requests sent from the Envoy agent to the upstream cluster with status code 5xx. Upstream Connections (Total) Record the number of active connections with the upstream cluster. Active connections are valid connections established with the upstream cluster, indicating the number of connections in use. Up delay It is used to group the response time of upstream cluster requests into predefined time intervals (or buckets) and record the number of requests in each time interval. CPS(upstream) This is used to record the total number of connections made to the upstream cluster, it counts all connections made to the upstream cluster, whether they are active or closed. RPS(Uplink) The number of all requests sent by the agent to the upstream cluster is recorded, which helps to monitor and measure the request traffic to and from the upstream cluster. -
Click the Resource Planel tab to view the resource monitoring information.
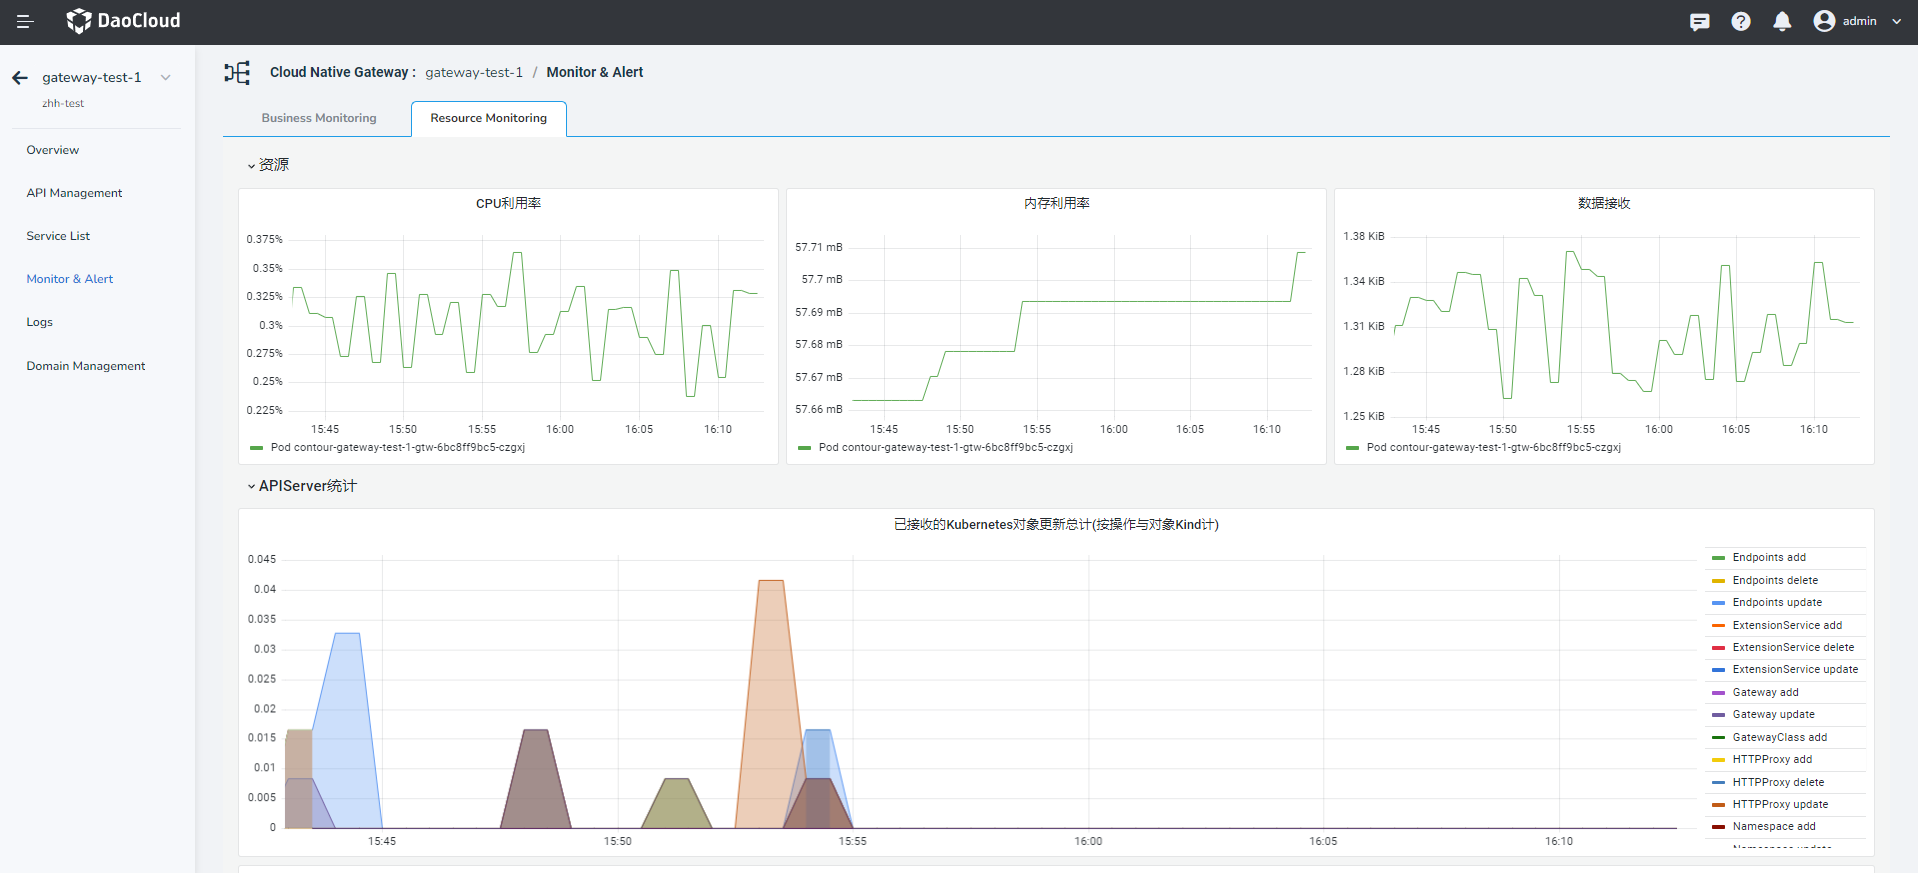
Items Description CPU utilization This is used to monitor the CPU utilization of Pods in a Kubernetes cluster. Memory utilization This is used to monitor the Memory utilization of Pods in a Kubernetes cluster. Data reception This is used to monitor the number of network bytes received by Pods in a Kubernetes cluster. Total Kubernetes object updates received (by operation and object Kind) The average of the total number of changes generated by the Contour triggered by Kubernetes events over time, sorted by operation and object type. Total Kubernetes object updates received (by object Kind) The average of the total number of changes generated by Contour triggered by Kubernetes events over time, sorted by object type. HTTPProxy(Total) This is used to monitor the number of HTTPProxy resources (number of gateway apis + number of gateway domain names). HTTPProxy(Orphan) This is used to monitor whether isolated HTTPProxy resources (HTTPProxy in orphaned state) exist. HTTPProxy(effective) This is used to monitor the existence of a valid HTTPProxy resource (an HTTPProxy with valid status). HTTPProxy(invalid) This is used to detect the presence of an invalid HTTPProxy resource (HTTPProxy in Invalid state).