How to implement the Ceph Dashboard dashboard
This page demonstrates how to import and successfully use the Ceph Monitoring Plane in DCE 5.0.
Deploy Rook-ceph in DCE 5.0
Deploy Rook-ceph first, then deploy rook-ceph-cluster.
-
Since Ceph has no offline support at present, it is necessary to add an agent on the node where the working cluster is located (in the test, the working cluster is built in the demo-dev environment and the intranet)
-
Due to the limited number of working nodes when deploying rook-ceph-cluster, you also need to set:
allowMultiplePerNode: true
Deploy Insight Agent in a worker cluster
To collect the monitoring metrics of rook-ceph-cluster, you need to Install Insight Agent, Then create CR ServiceMonitor to collect monitoring information of rook-ceph-cluster.
-
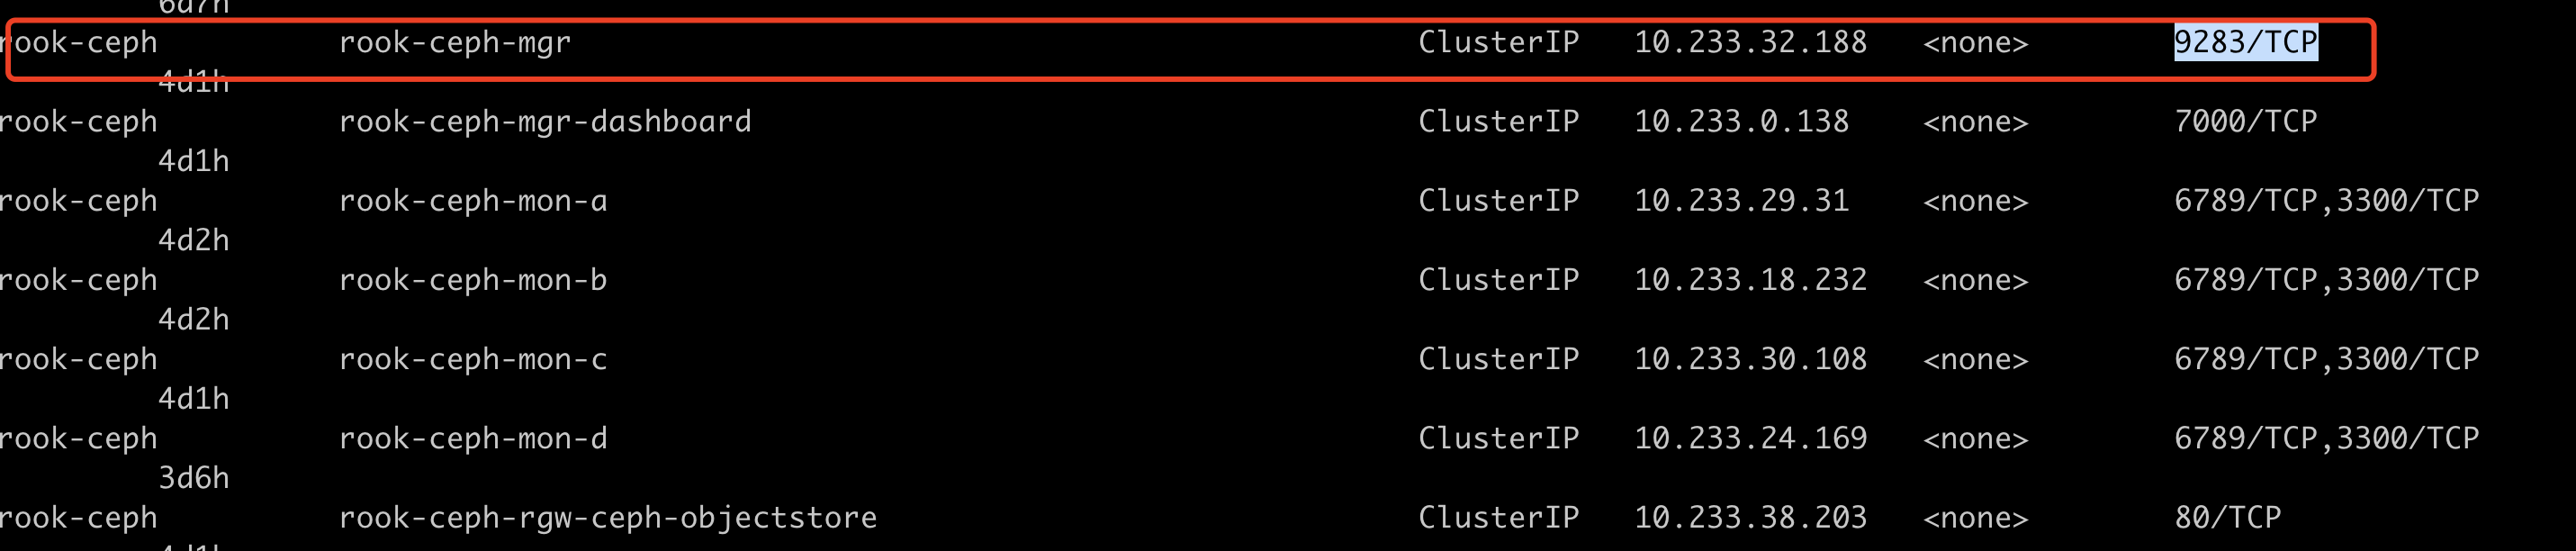
The monitoring metrics of rook-ceph-cluster are exposed through port 9283.
-
Create a ServiceMonitor for rook-ceph-mgr [Create a ServiceMonitor] in the worker cluster (../../insight/user-guide/collection-manag/service-monitor.md#_3).
apiVersion: monitoring.coreos.com/v1
kind: ServiceMonitor
metadata:
labels:
  operator.insight.io/managed-by: insight
name: rook-ceph-sm
namespace: rook-ceph
spec:
endpoints:
  - honorLabels: true
  port: http-metrics
namespaceSelector:
  any: true
selector:
  matchLabels:
  app: rook-ceph-mgr
  rook_cluster: rook-ceph
Deploy GrafanaDashboard in the Global cluster
Refer to Dashboard Template to deploy GrafanaDashboard.
See Insight Import Dashboard when importing templates.
apiVersion: grafana.integreatly.org/v1beta1
kind: Grafana Dashboard
metadata:
  labels:
    app: insight-grafana-operator
    operator.insight.io/managed-by: insight
  name: ceph-dashboard
  namespace: insight-system
spec:
  allowCrossNamespaceImport: true
  instanceSelector:
    matchLabels:
      operator.insight.io/managed-by: insight
  json: >
    {
        "__inputs": [],
        "__elements": {},
        "__requires": [
        {
          "type": "panel",
          "id": "gauge",
          "name": "Gauge",
          "version": ""
        },
        {
            "type": "grafana",
            "id": "grafana",
            "name": "Grafana",
            "version": "9.0.5"
        },
....
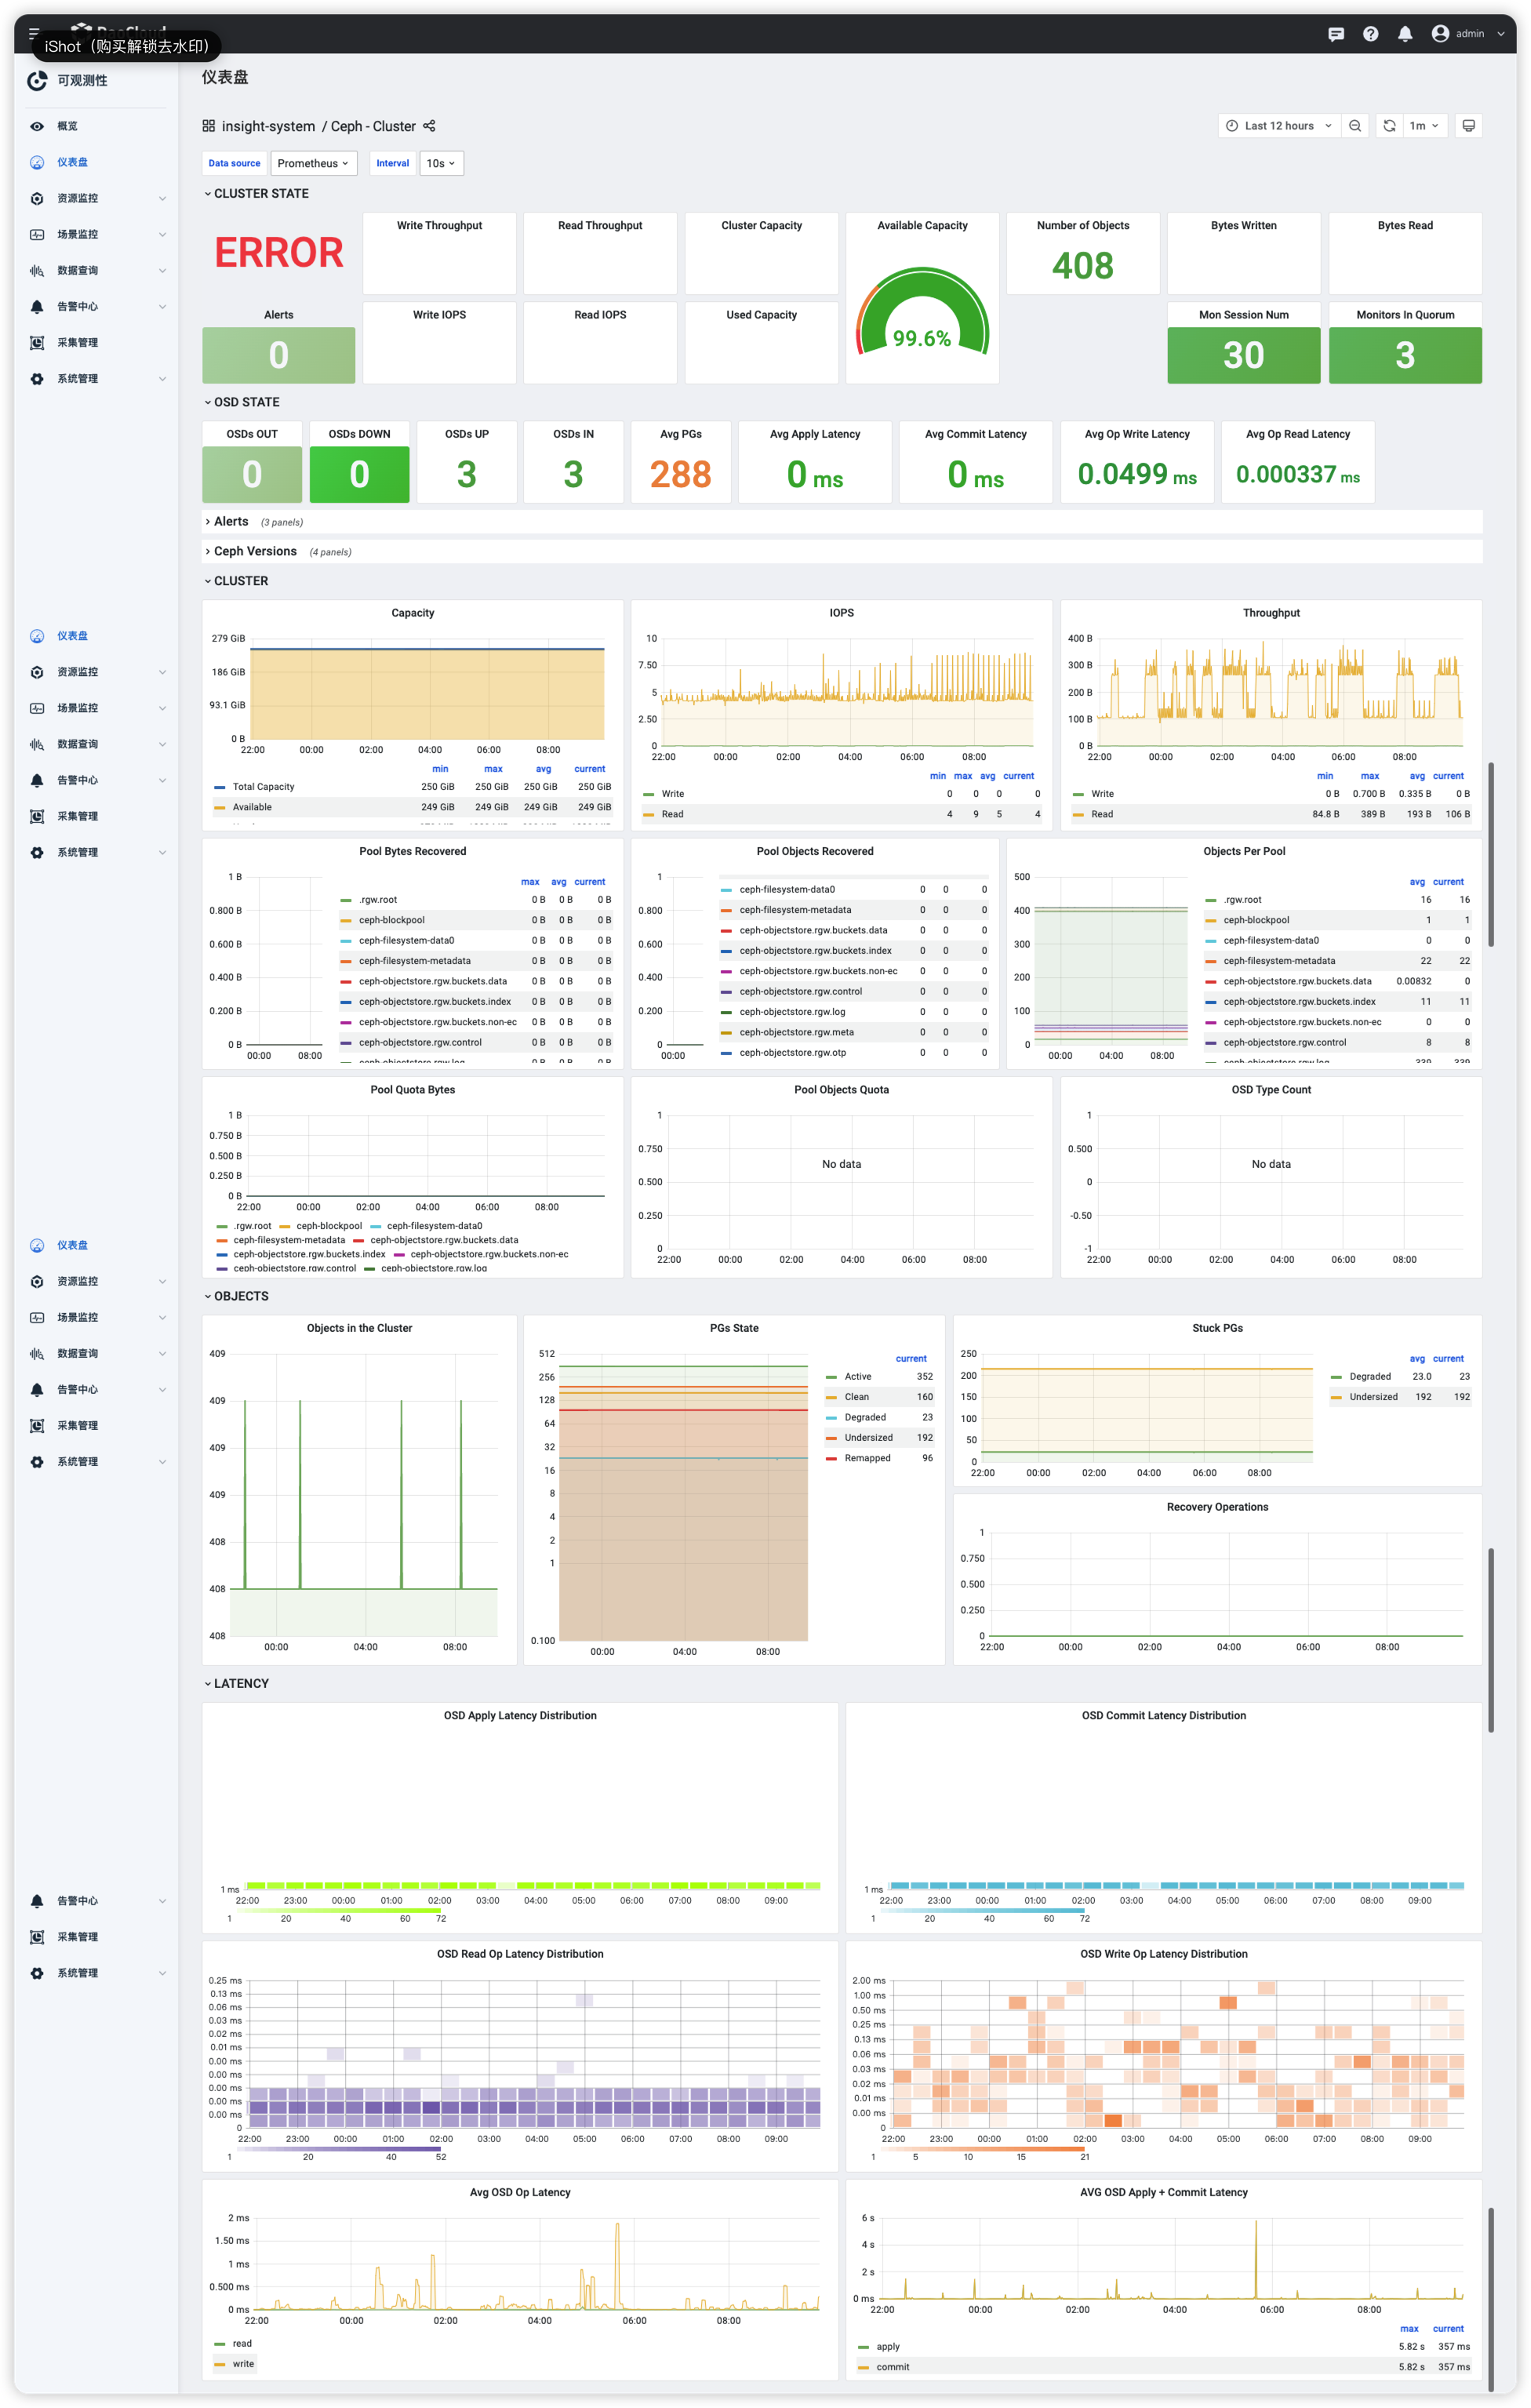
View Ceph Monitoring Dashboard
The current panel does not distinguish between clusters, and the cluster identification option will be optimized and added in the future.