Service Monitoring
Observability Insight provides monitoring of service indicators, and can view key indicators such as real-time throughput, number of requests, request delay, and error rate of services.
Prerequisites
The insight-agent is installed in the cluster and the application is in running state. If not installed, please refer to: Installing insight-agent to collect data
View node details
-
In the left navigation bar, select
Scene Monitoring->Service Monitoring.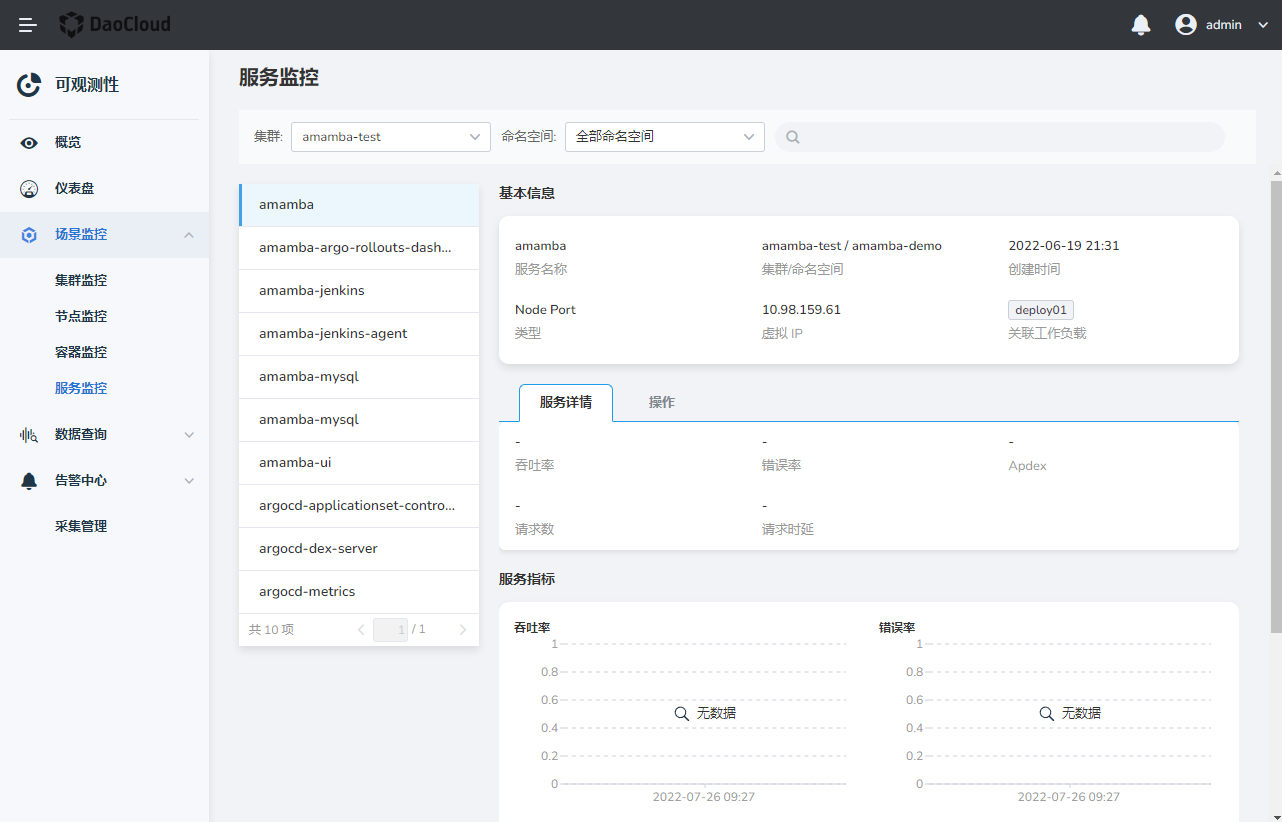
-
In the service details, you can view the current throughput, number of requests, request delay, and error rate of the service, as well as the change trend.
- Throughput: the number of requests received by the service per second
- Error rate: percentage of bad requests
- Number of requests: the number of requests initiated by the server
- Request rate: the time it takes for the server to process the request
-
Switch to the
Operationtab to view the service call information within the time range.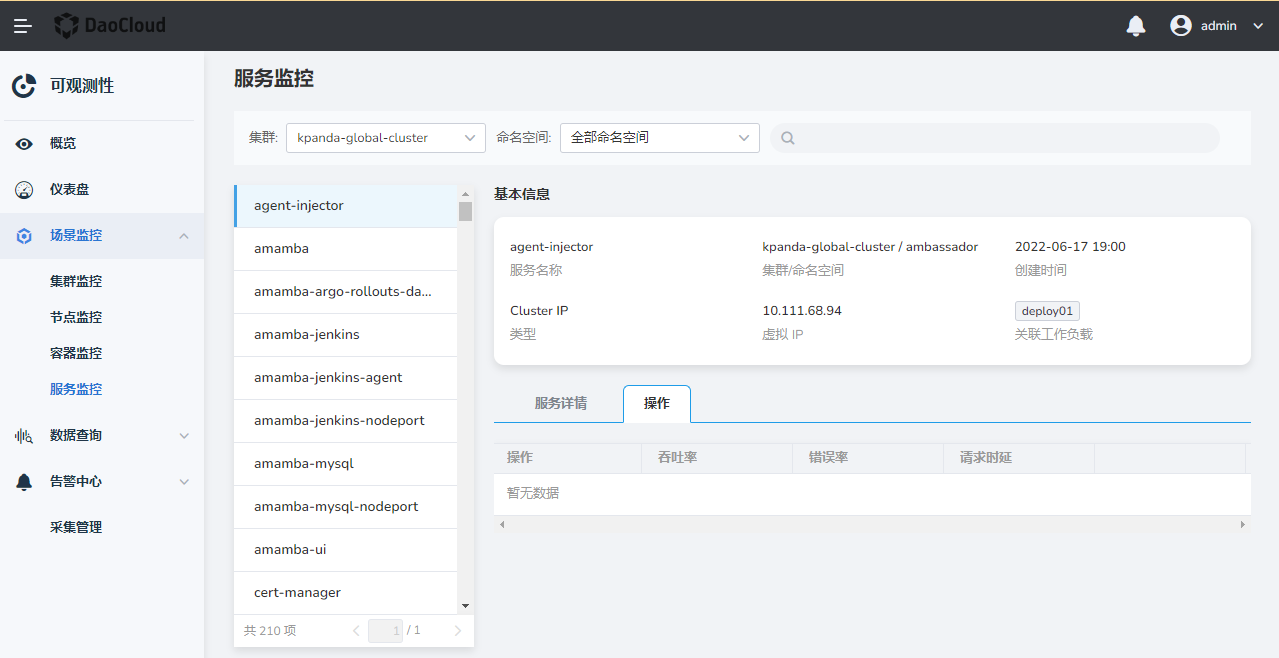
-
In the operation column, click
View Linkto view the detailed information of the link.