overview
This article introduces the overview information of the clusters managed in Container Management, including the abnormal number and total number of all cluster resources, alarms, link data, and log data statistics, the resource usage of Top5 clusters and nodes, and the status of nodes and container groups. Top 5 trends and service delays.
-
Select
Overviewin the left navigation bar to enter the details page.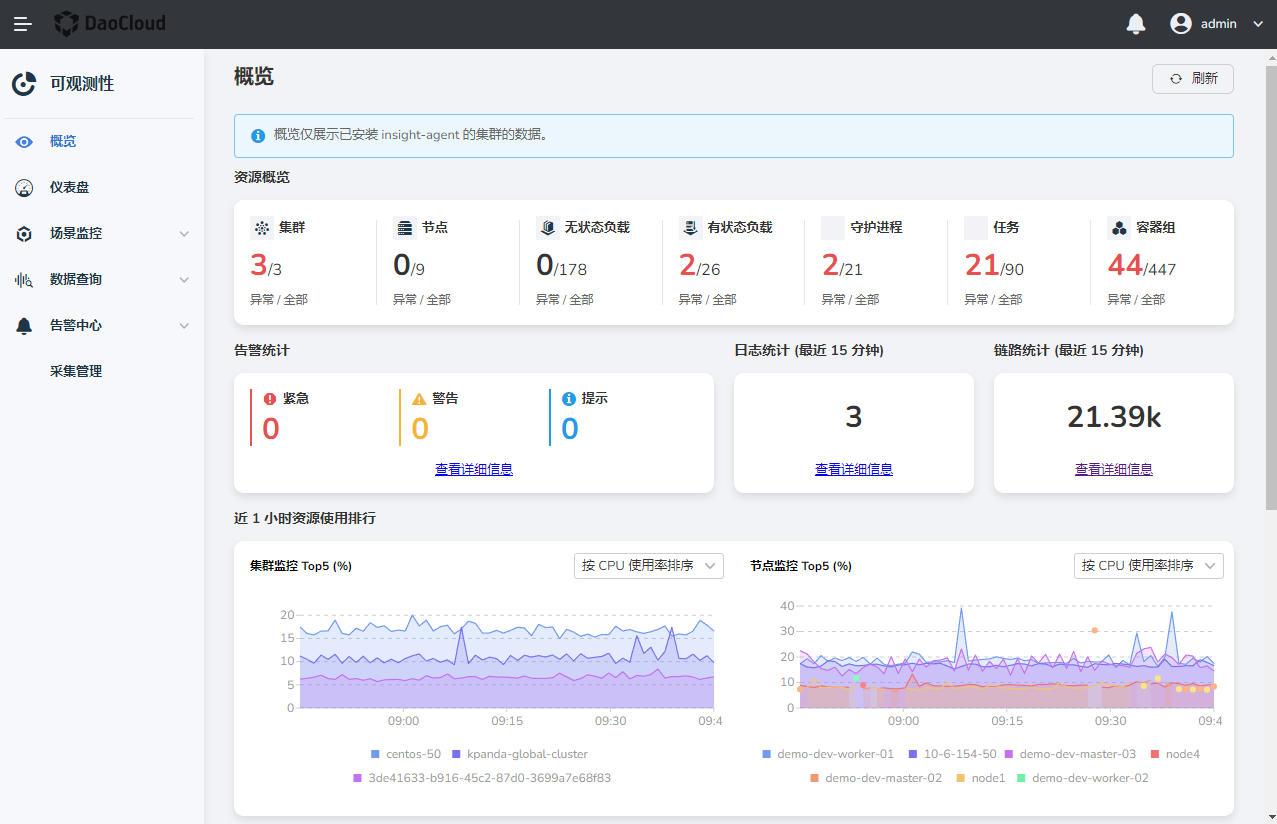
-
(Optional) Click the
Refreshbutton in the upper right corner to automatically update the data.- Alarm statistics: You can view the alarm statistics of all clusters.
- Resource consumption: You can view the resource change trends of TOP5 clusters and nodes in the past hour according to CPU usage, memory usage, and disk usage. The default is to sort by CPU usage. You can switch indicators to switch the sorting method of clusters and nodes.
- Resource change trend: You can view the trend of the number of nodes in the past 15 days and the running trend of Pods in one hour.
- Service request ranking: You can view the TOP5 services in the multi-cluster request delay and error rate, as well as their clusters and namespaces.