Trace Collection Troubleshooting Guide
Before attempting to troubleshoot issues with trace data collection, you need to understand the transmission path of trace data. The following is a schematic diagram of the transmission of trace data:
graph TB

sdk[Language proble / SDK] --> workload[Workload cluster otel collector]
--> otel[Global cluster otel collector]
--> jaeger[Global cluster jaeger collector]
--> es[Elasticsearch cluster]

classDef plain fill:#ddd,stroke:#fff,stroke-width:1px,color:#000;
classDef k8s fill:#326ce5,stroke:#fff,stroke-width:1px,color:#fff;
classDef cluster fill:#fff,stroke:#bbb,stroke-width:1px,color:#326ce5;

class sdk,workload,otel,jaeger,es cluster
As shown in the above figure, any transmission failure at any step will result in the inability to query trace data. If you find that there is no trace data after completing the application trace enhancement, please perform the following steps:
-
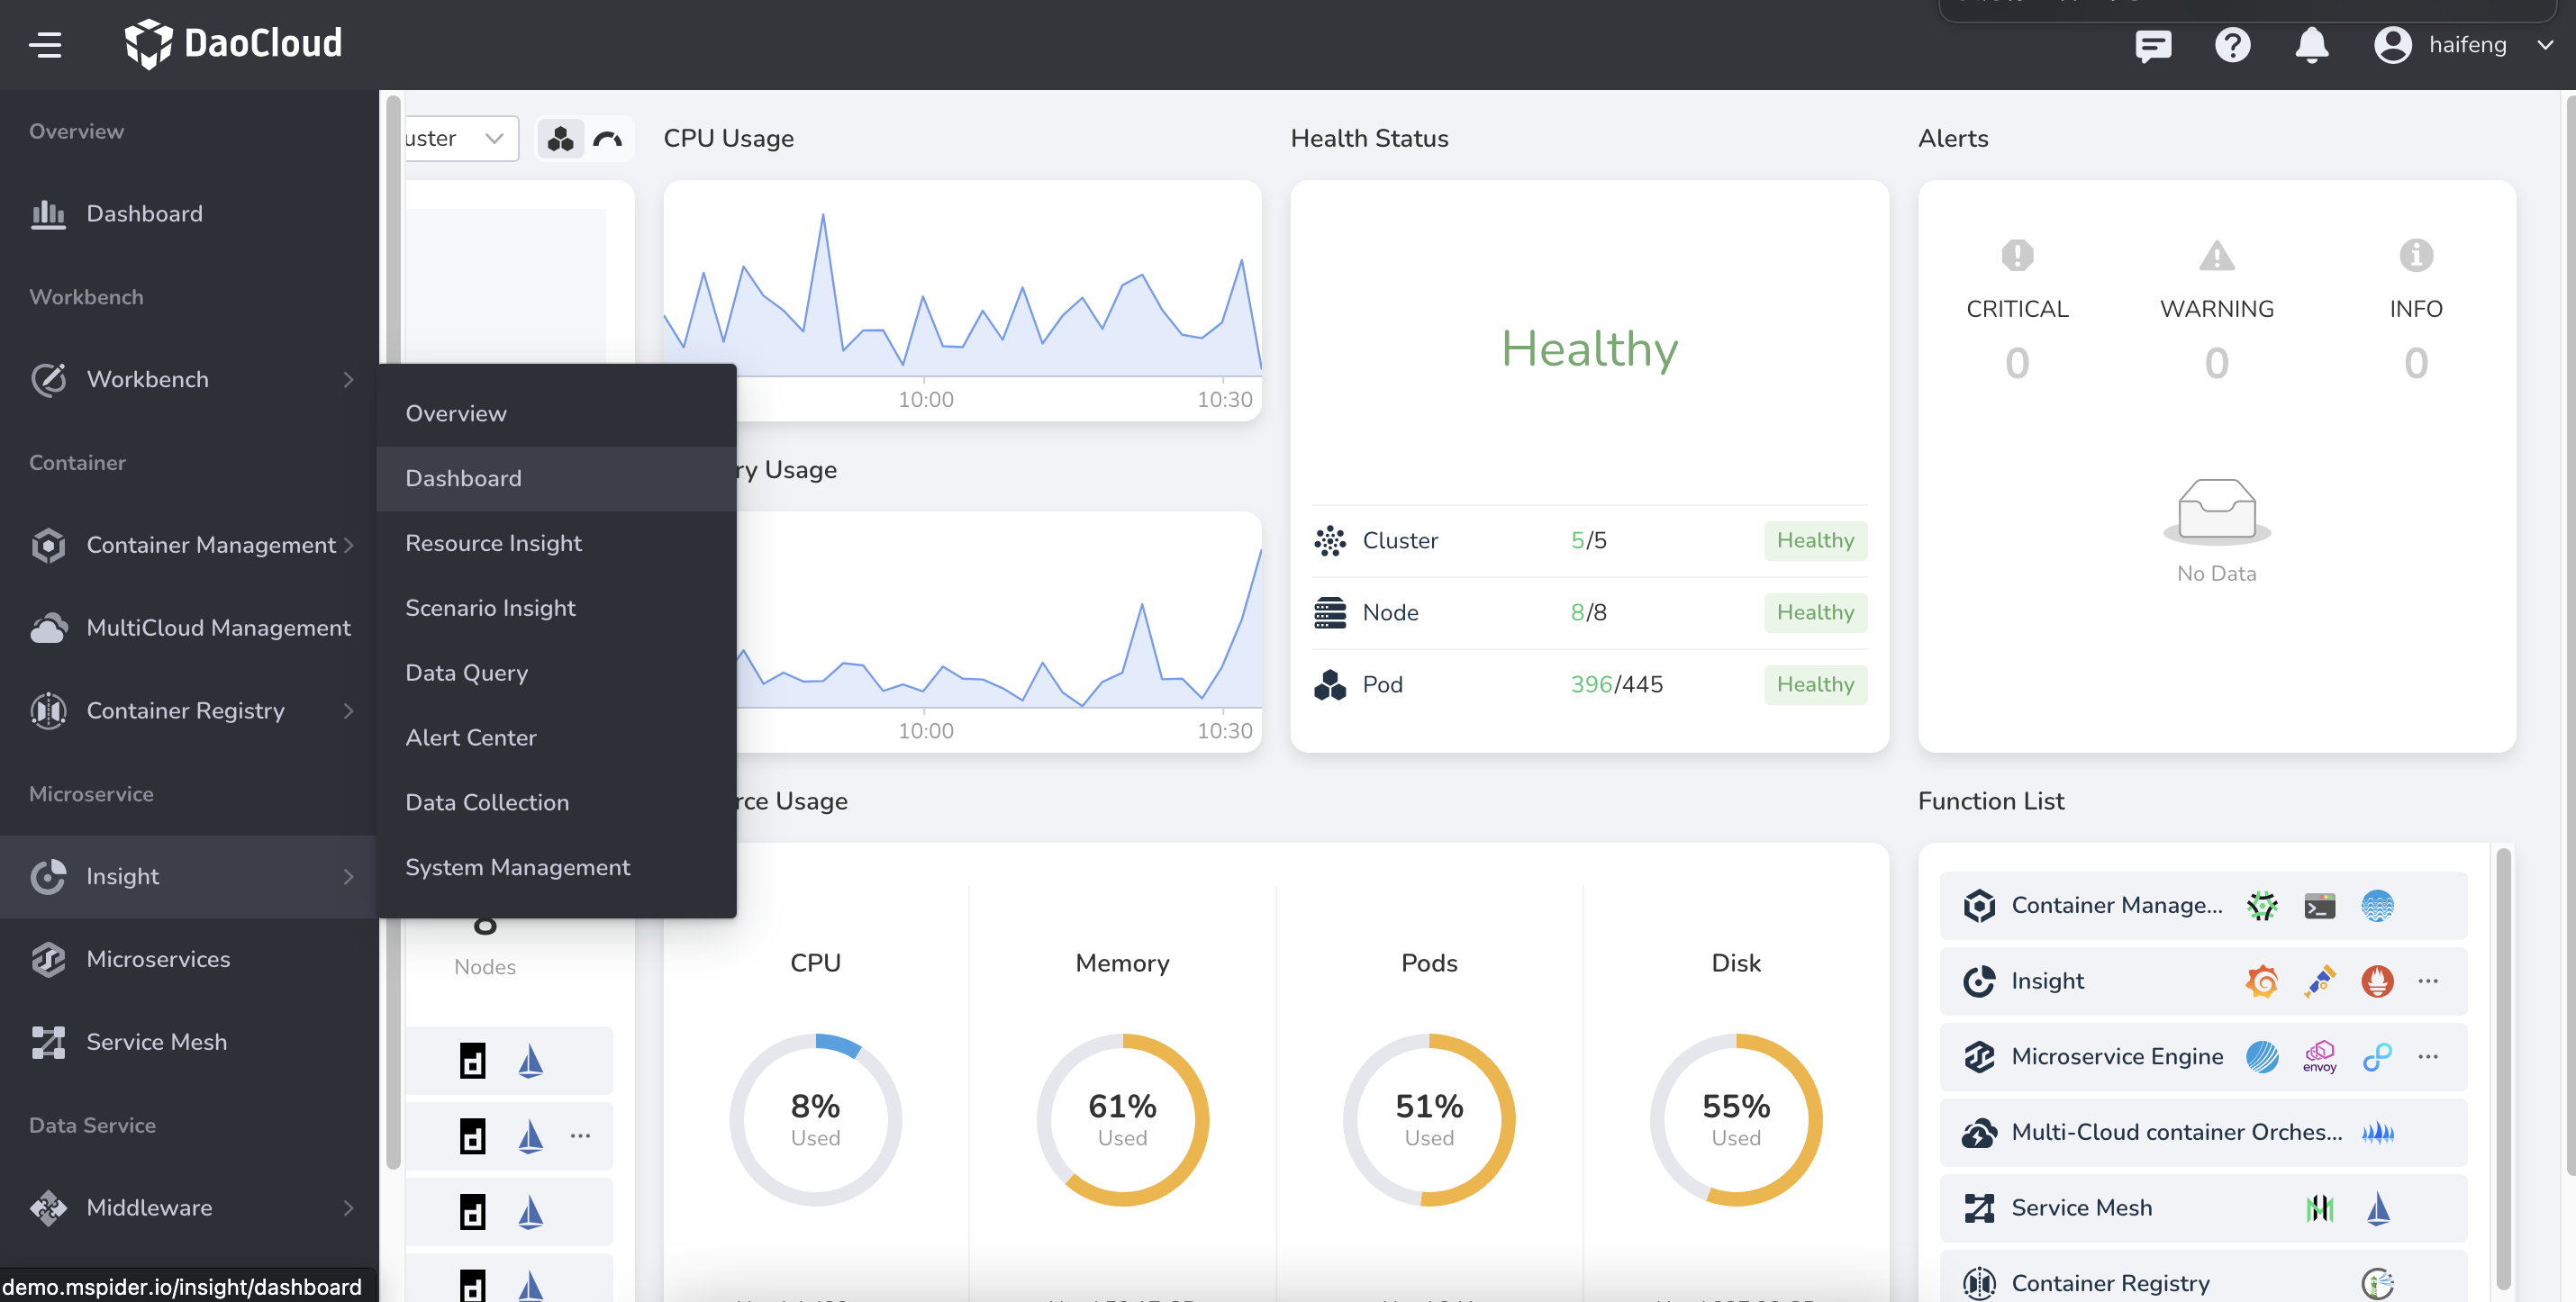
Use DCE 5.0 platform, enter Insight , and select the Dashboard in the left navigation bar.
-
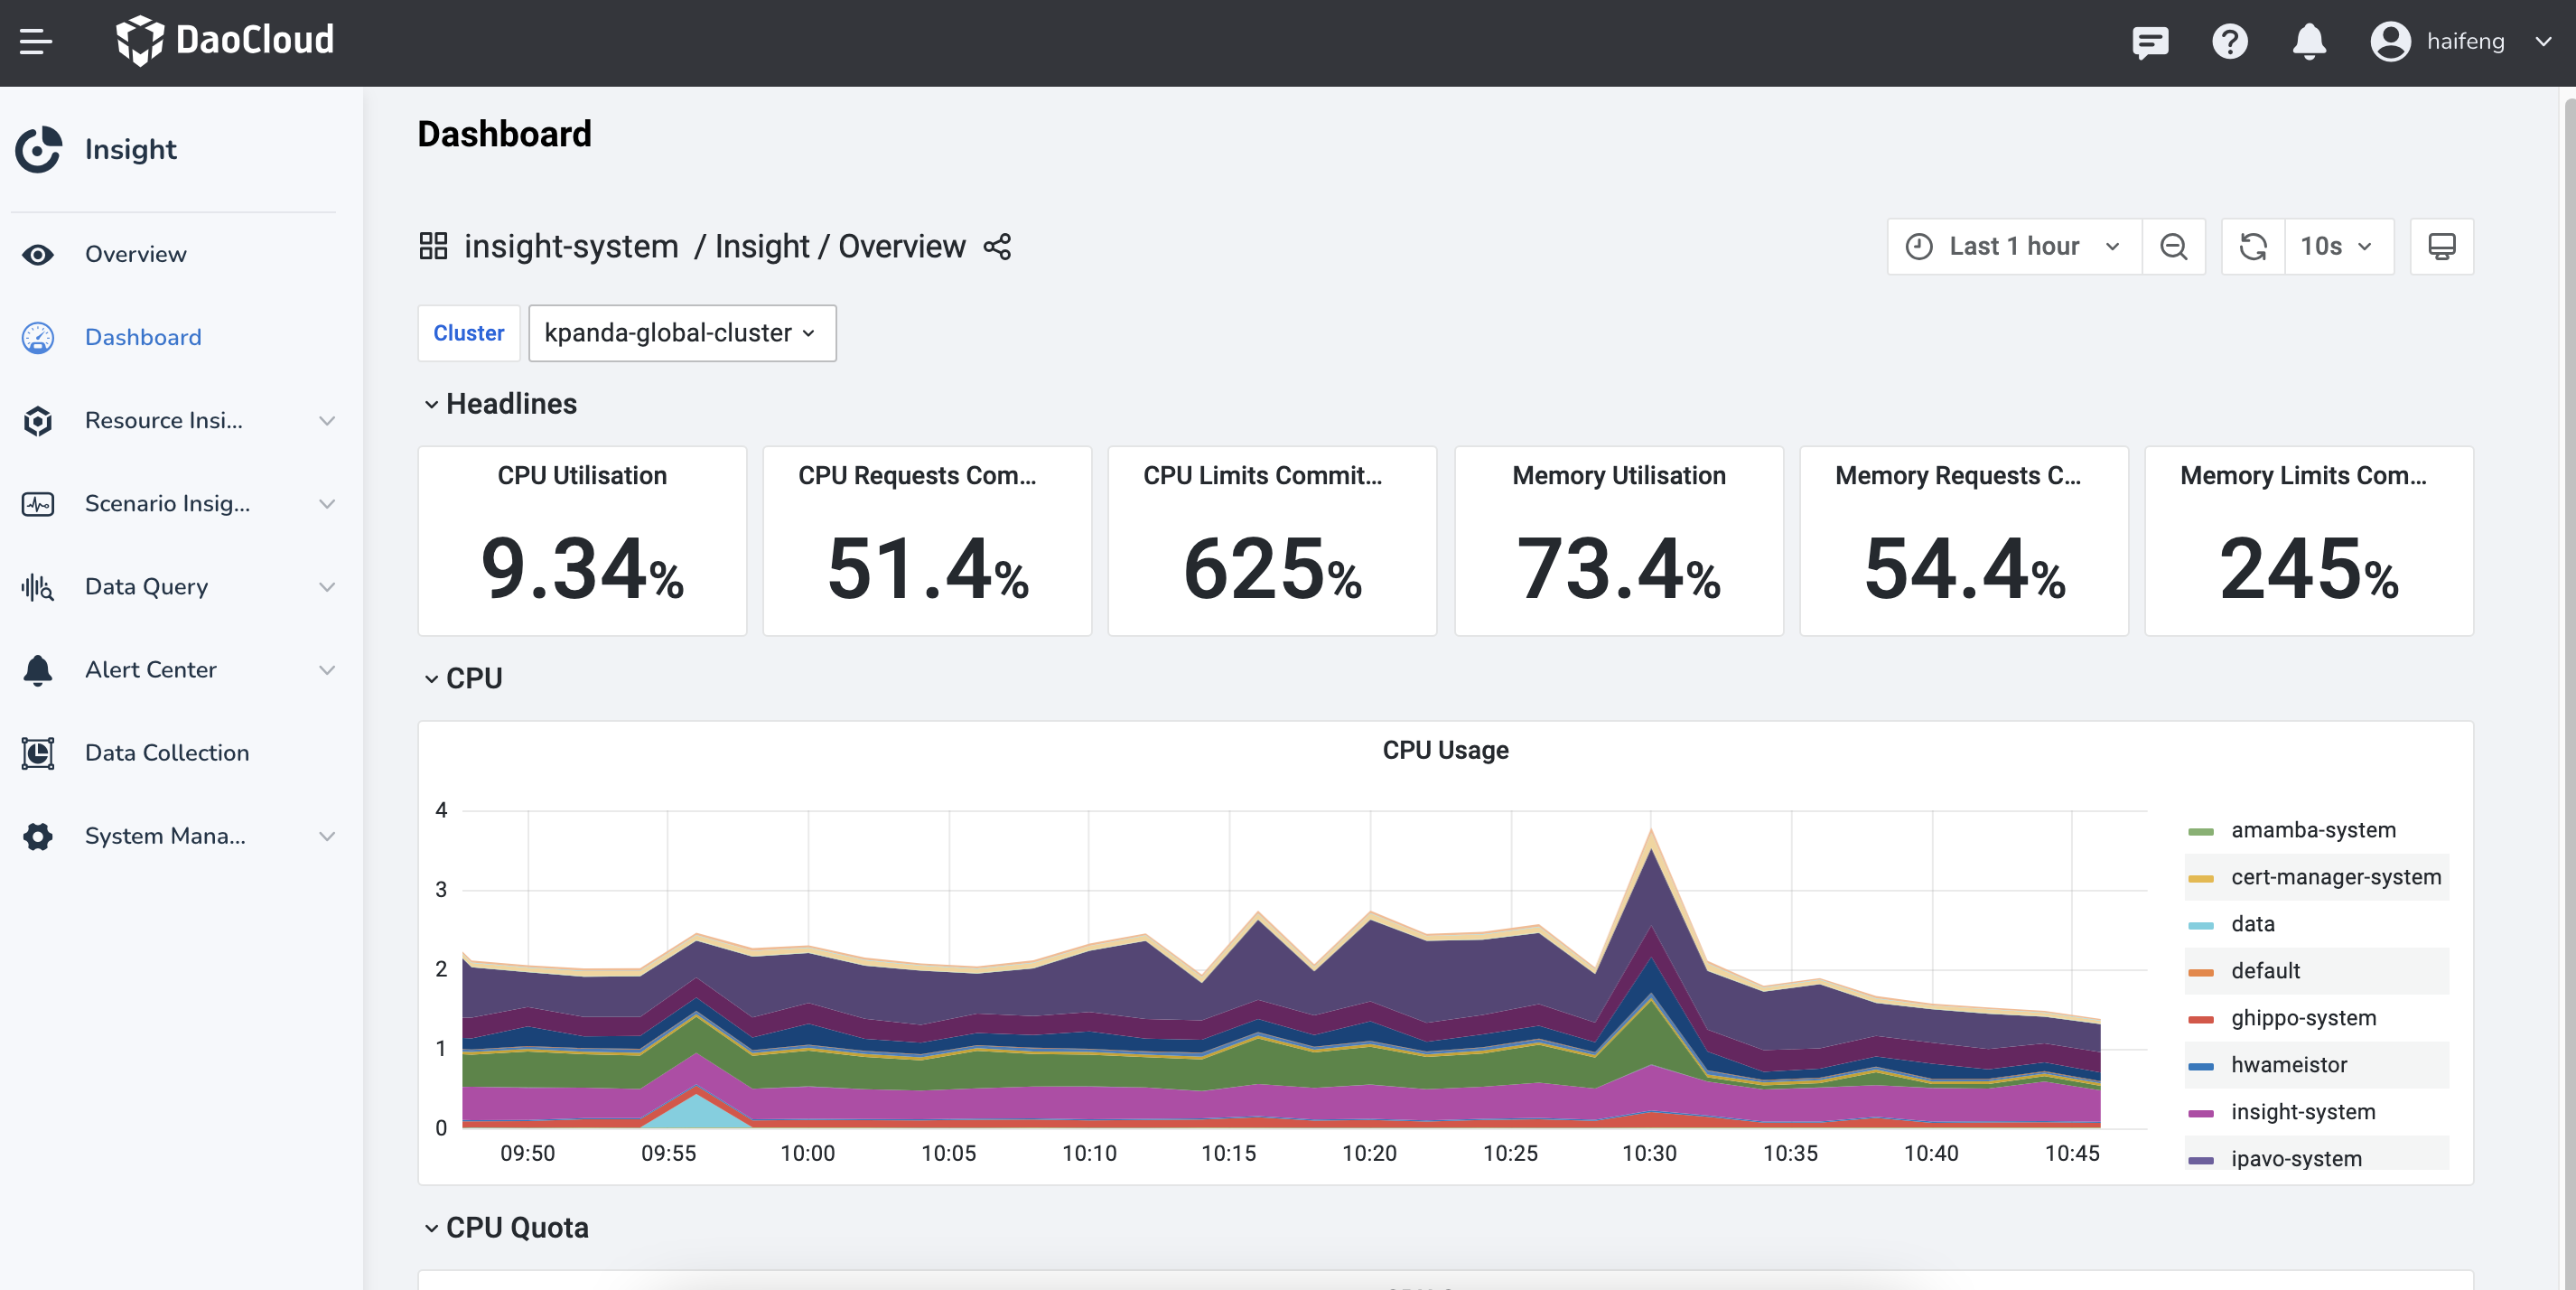
Click the dashboard title Overview .
-
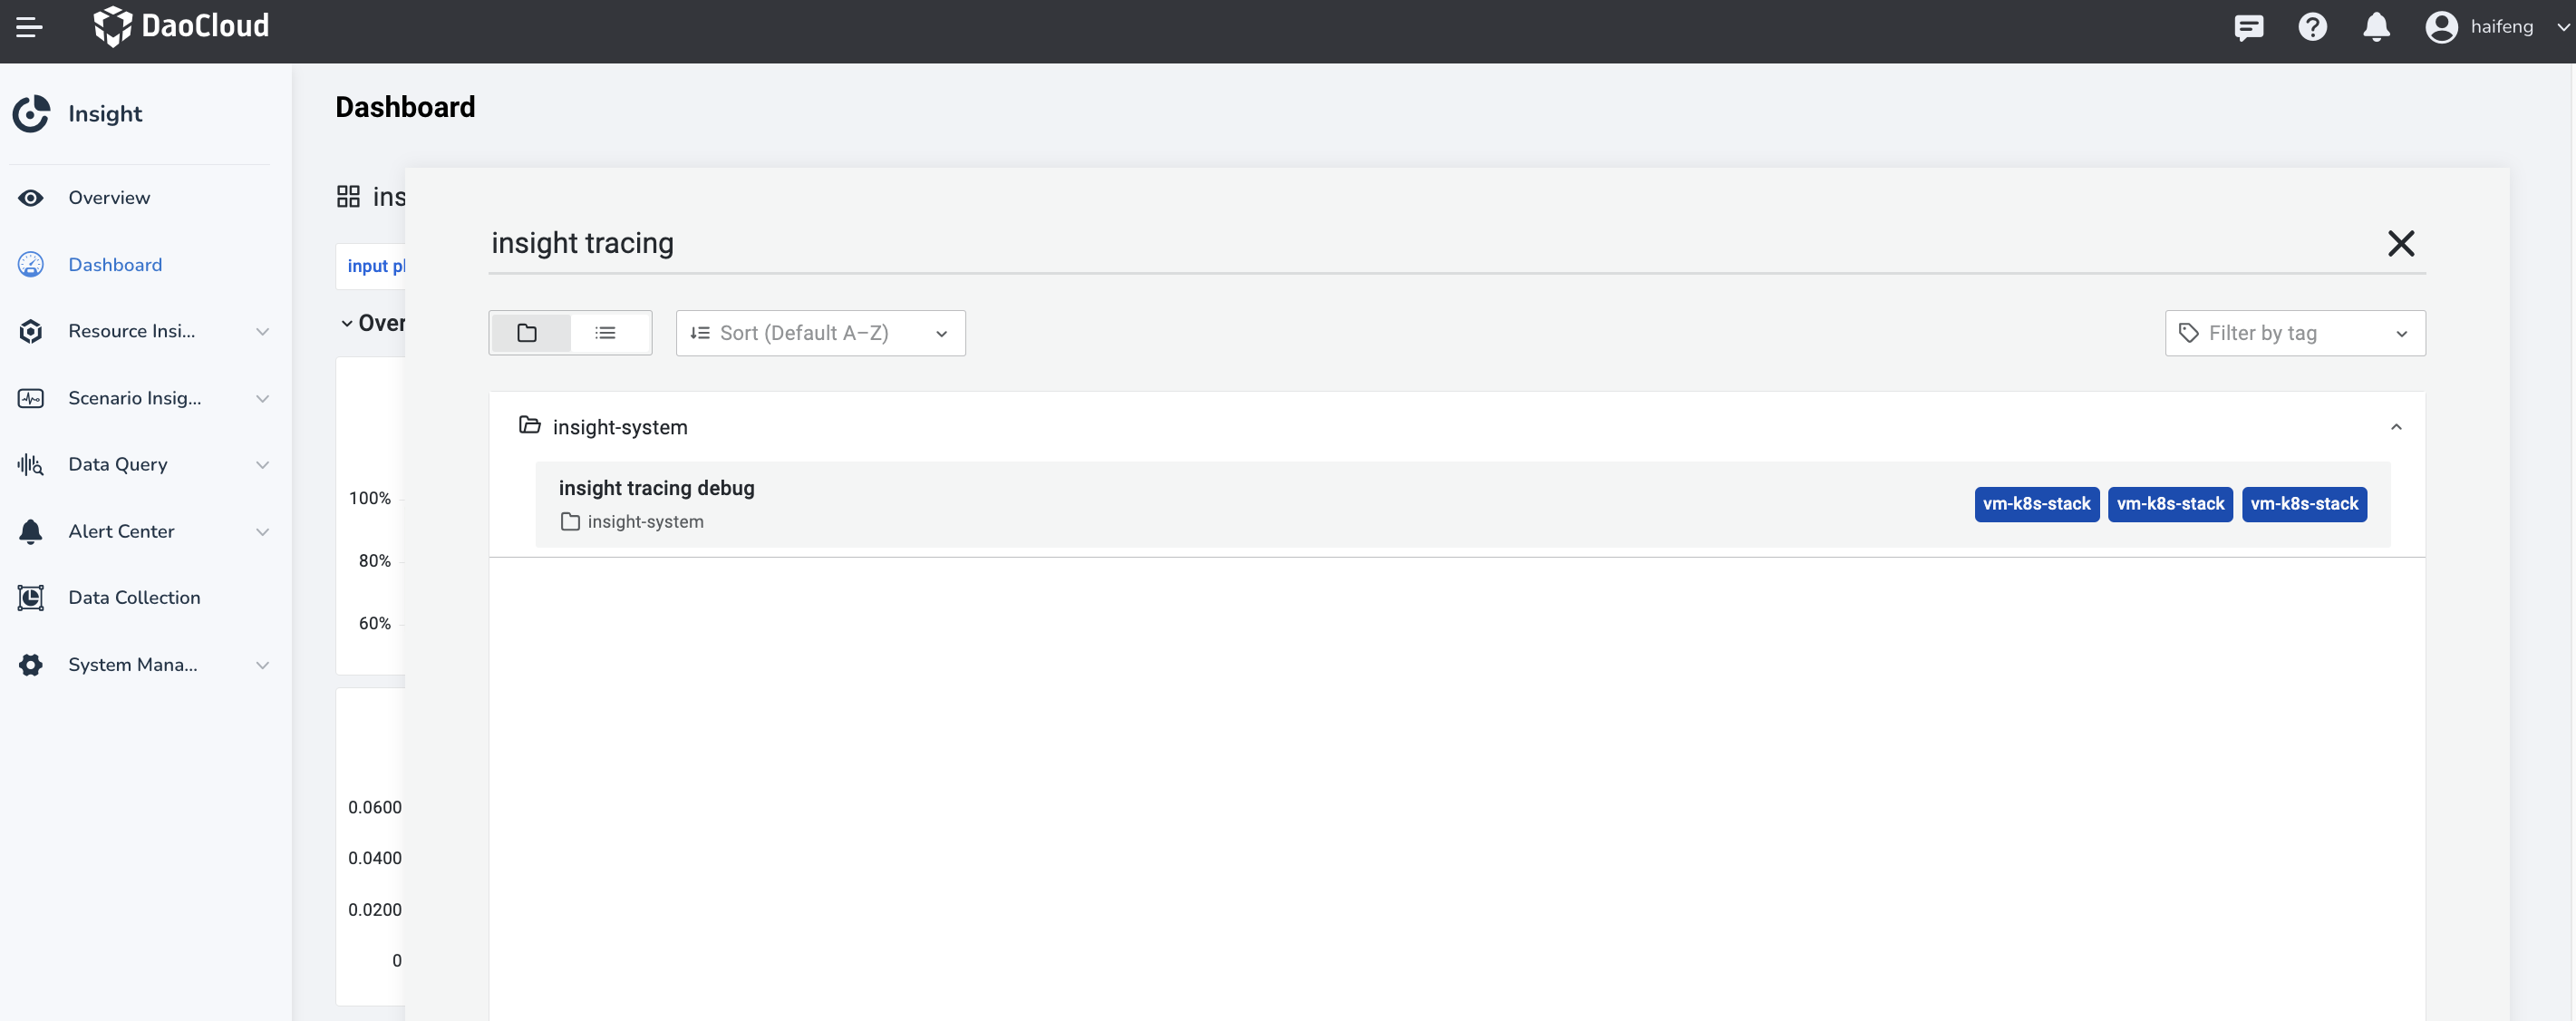
Switch to the insight-system -> insight tracing debug dashboard.
-
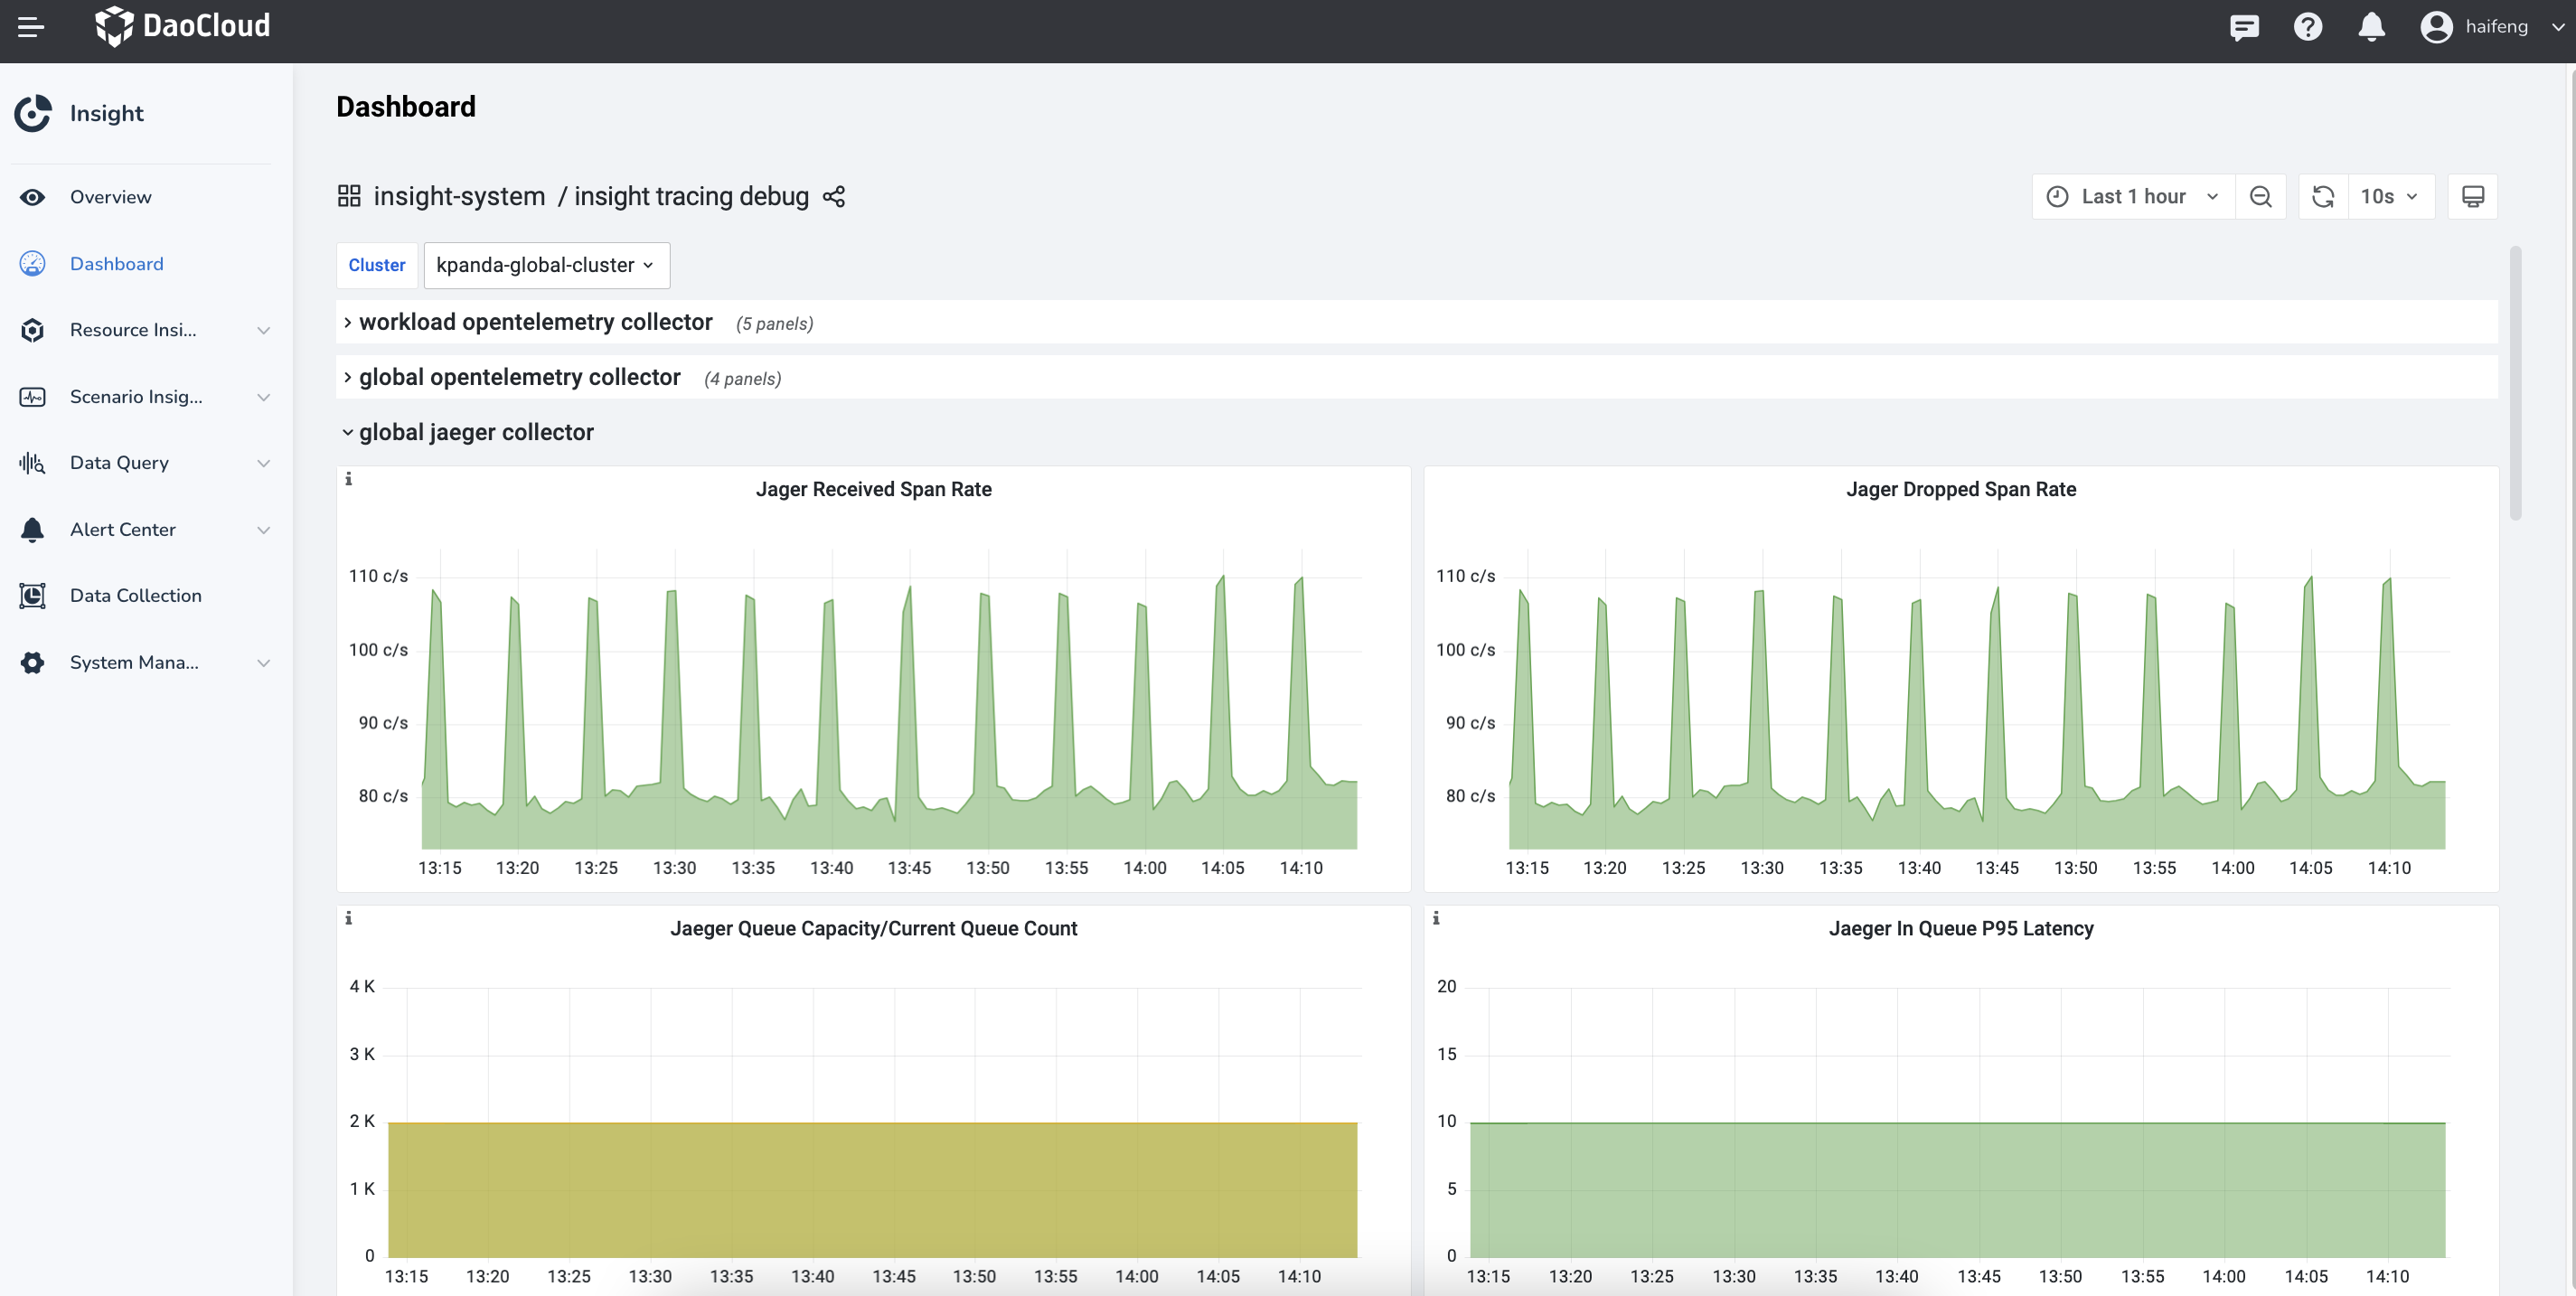
You can see that this dashboard is composed of three blocks, each responsible for monitoring the data transmission of different clusters and components. Check whether there are problems with trace data transmission through the generated time series chart.
- workload opentelemetry collector
- global opentelemetry collector
- global jaeger collector
Block Introduction
-
workload opentelemetry collector
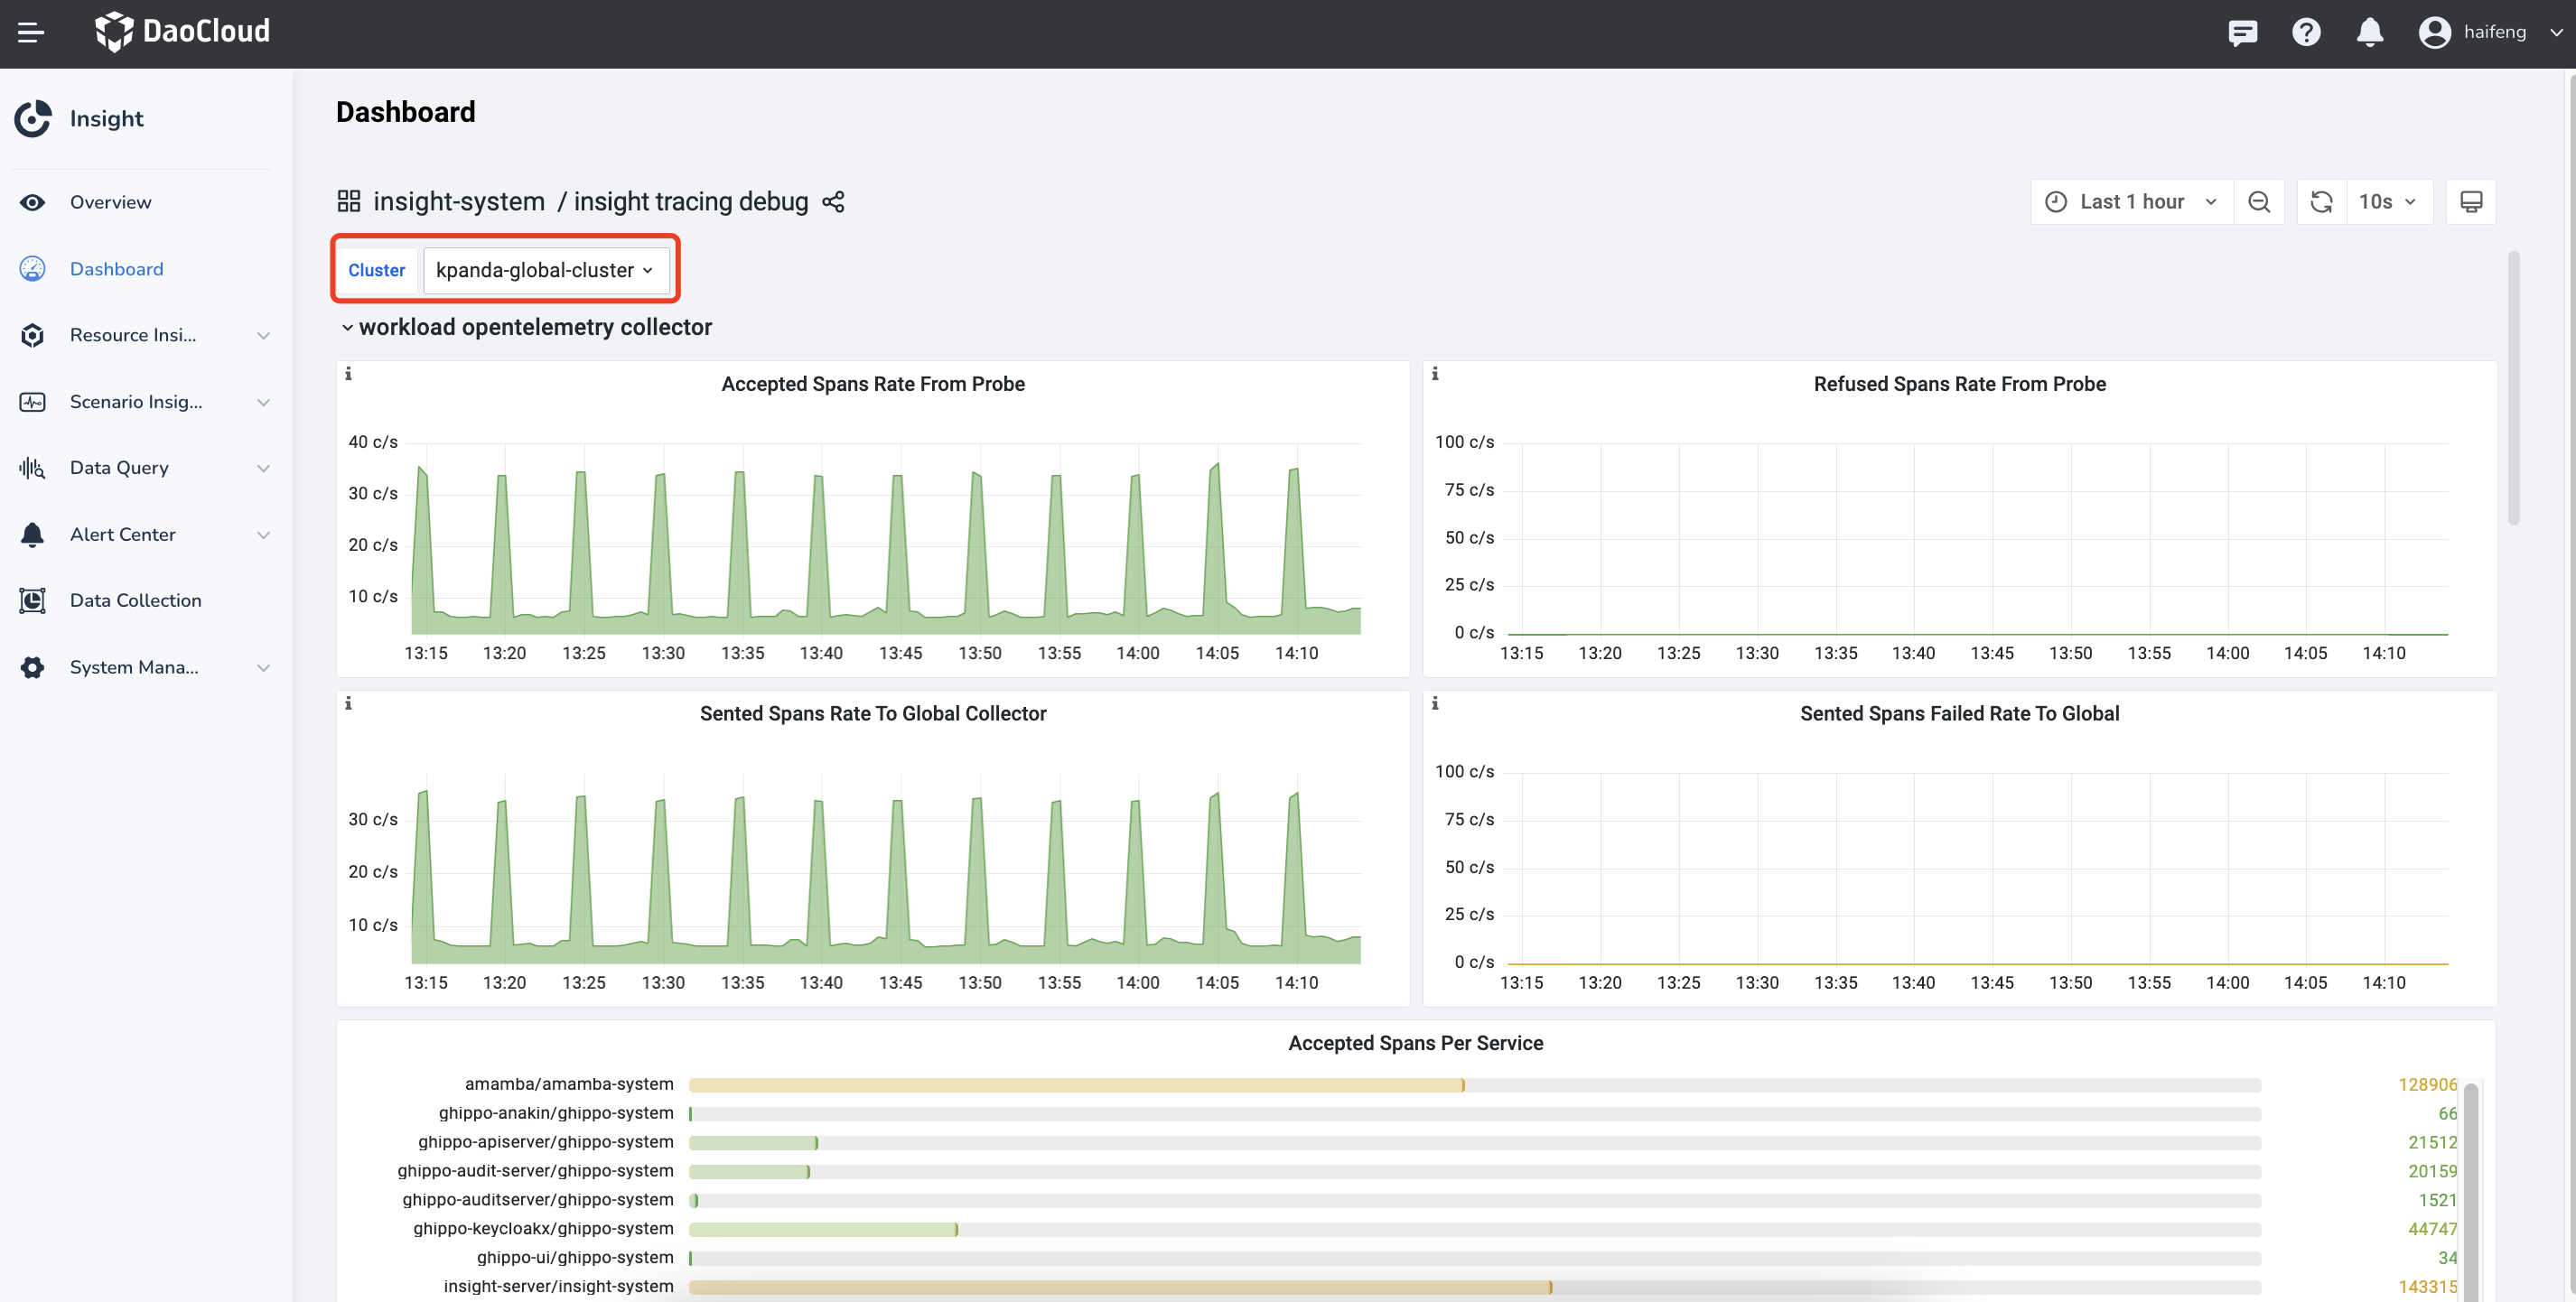
Display the opentelemetry collector in different worker clusters receiving language probe/SDK trace data and sending aggregated trace data. You can select the cluster where it is located by the Cluster selection box in the upper left corner.
Note
Based on these four time series charts, you can determine whether the opentelemetry collector in this cluster is running normally.
-
global opentelemetry collector
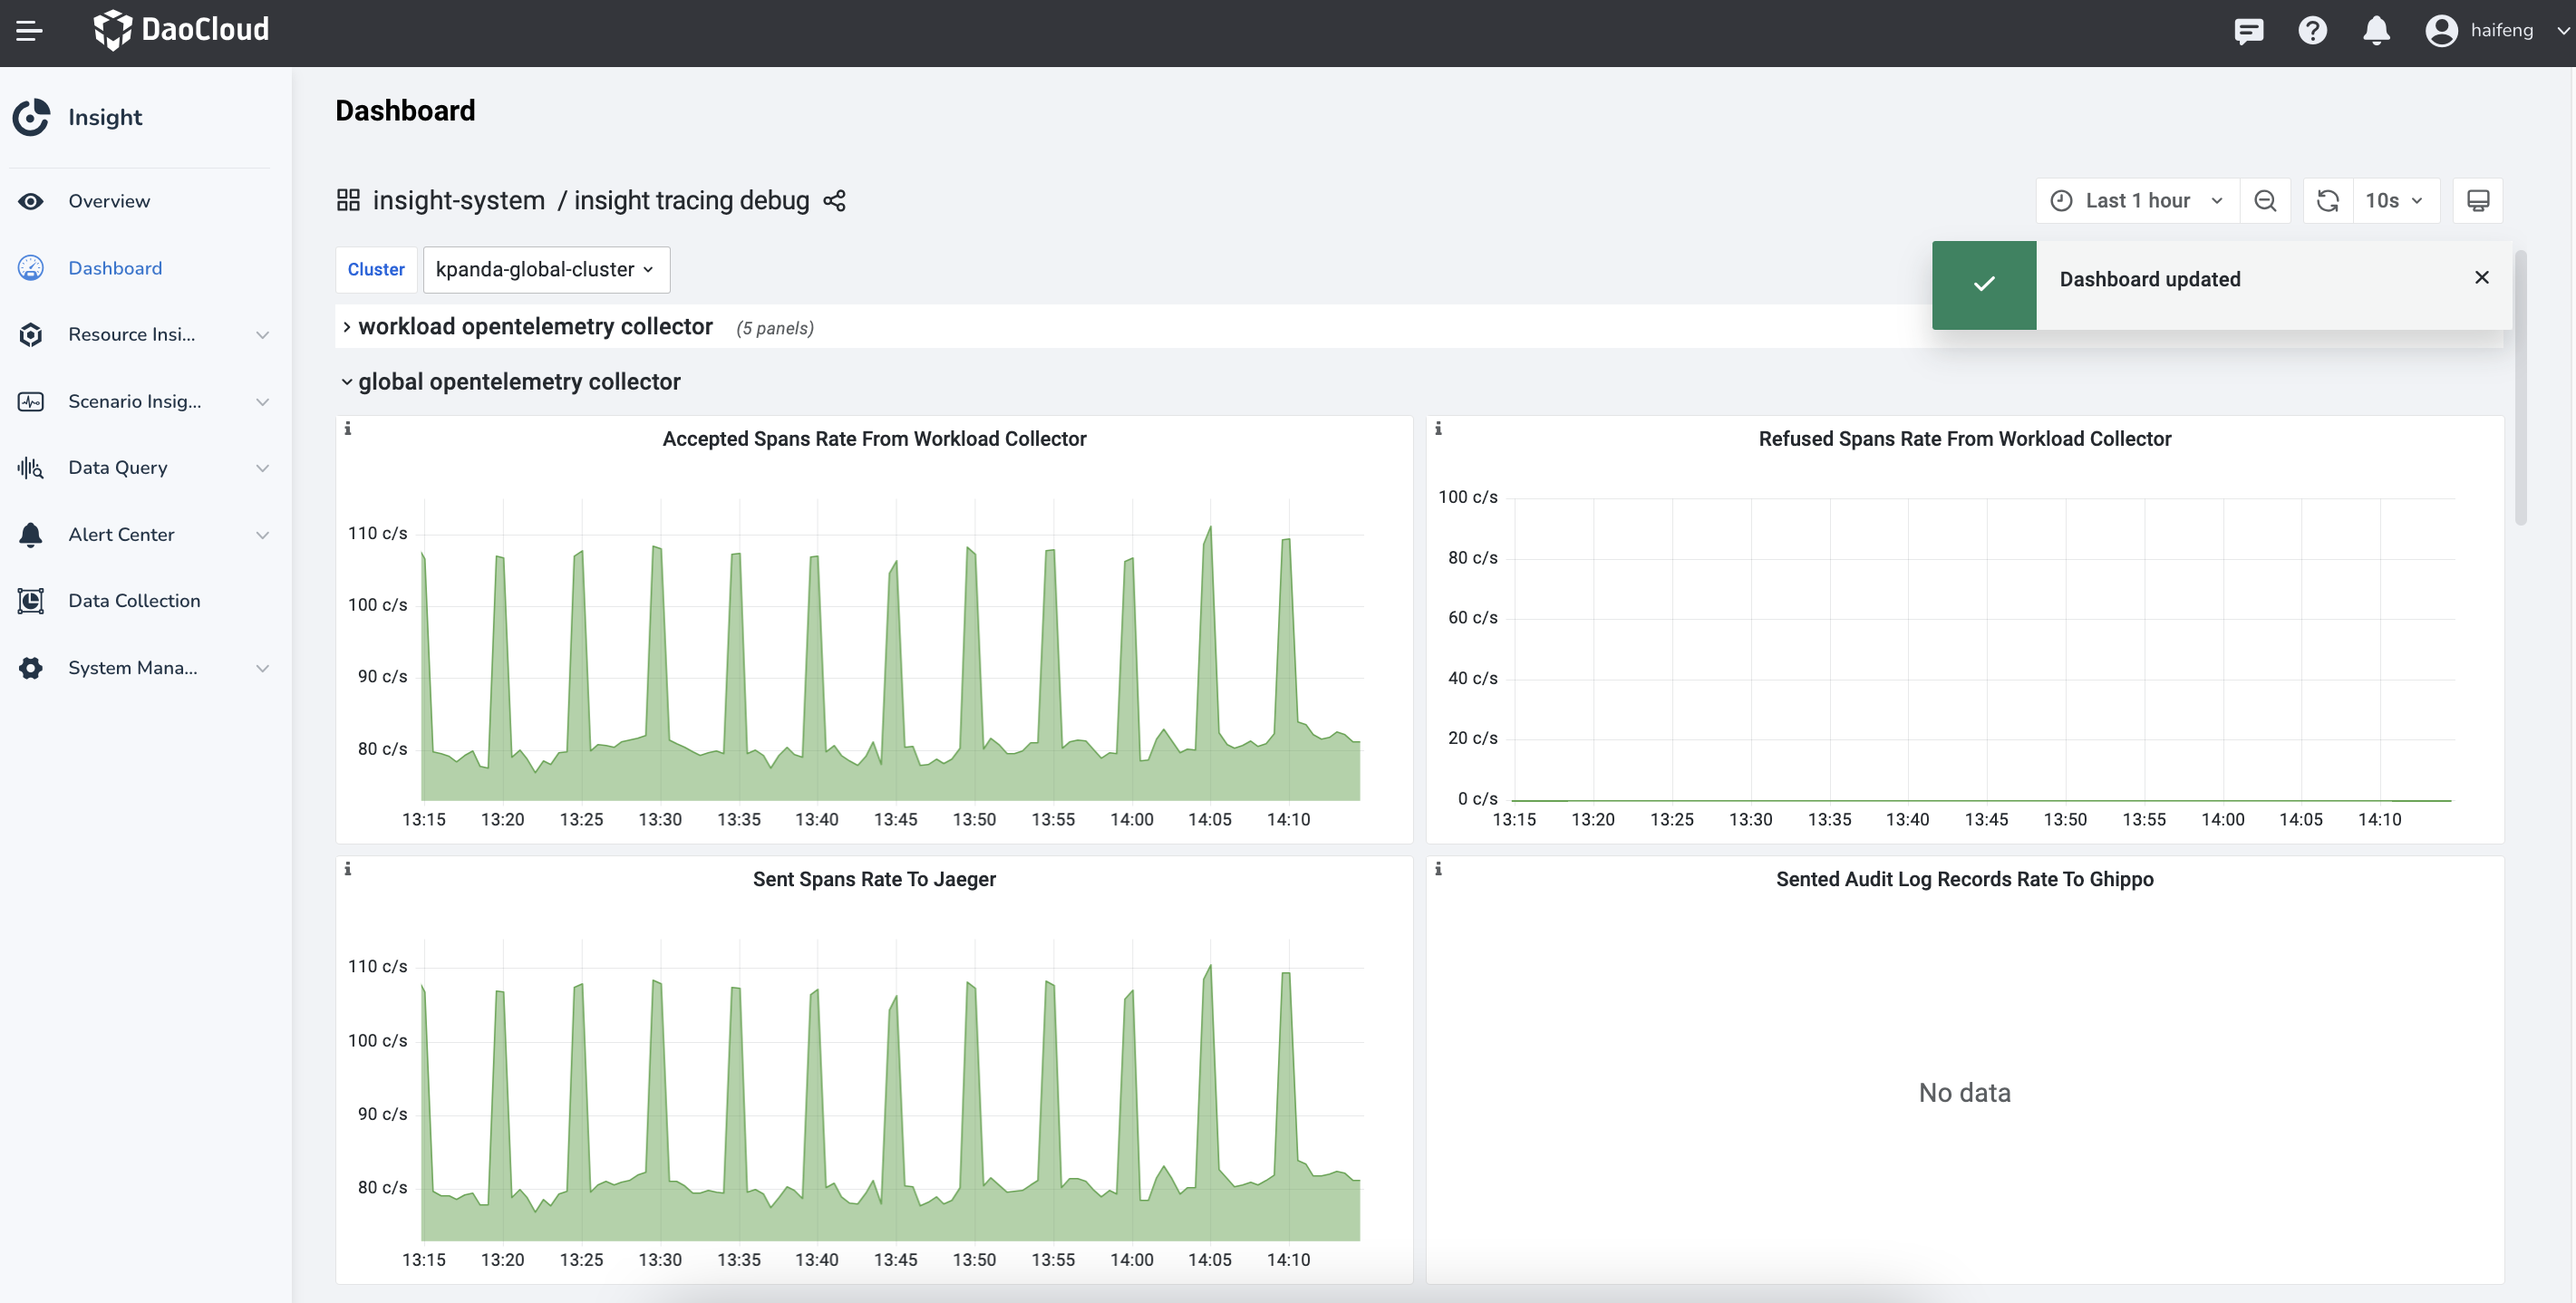
Display the opentelemetry collector in the Global Service Cluster receiving trace data from the worker cluster's opentelemetry collector and sending aggregated trace data.
Note
The opentelemetry collector in the Global Management Cluster is also responsible for sending audit logs of all worker clusters' global management module and Kubernetes audit logs (not collected by default) to the audit server component of the global management module.
-
global jaeger collector
Display the jaeger collector in the Global Management Cluster receiving data from the otel collector in the Global Management Cluster and sending trace data to the ElasticSearch cluster.