Integrate Nginx Ingress Trace Tracking
Report the traces information of the cluster's Nginx Ingress component to observable traces, and connect with backend service traces.
Enable Feature
The following uses Helm Chart to deploy Ingress-Nginx as an example:
To enable OpenTelemetry feature for ingress-nginx, edit the values.yaml file of ingress-nginx helm and add specific configuration.
The configuration involves multiple parameters such as enable-opentelemetry:"true", otlp-collector-host:insight-agent-opentelemetry-collector.insight-system.svc.cluster.local, otlp-collector-port:4317, etc.
# values.yaml
······
controller:
  config:
    enable-opentelemetry: "true"
    opentelemetry-config: "/etc/ingress-controller/telemetry/opentelemetry.toml"
    opentelemetry-operation-name: "HTTP $request_method $service_name $uri"
    opentelemetry-trust-incoming-span: "true"
    otlp-collector-host: "insight-agent-opentelemetry-collector.insight-system.svc.cluster.local"
    otlp-collector-port: "4317"
    otel-max-queuesize: "2048"
    otel-schedule-delay-millis: "5000"
    otel-max-export-batch-size: "512"
    otel-service-name: "ingress-nginx-controller.ingress-nginx" # 👈 Note the format
    otel-sampler: "AlwaysOn"
    otel-sampler-ratio: "1.0"
    otel-sampler-parent-based: "false"
Note that the otel-service-name parameter should be in the xxx.xxx format, where the first part is the service name and the second part is the k8s.namespace.name attribute. After ingress-nginx reports traces to insight-agent-opentelemetry-collector, the insight-agent-opentelemetry-collector will parse them according to this format.
Verify the Result
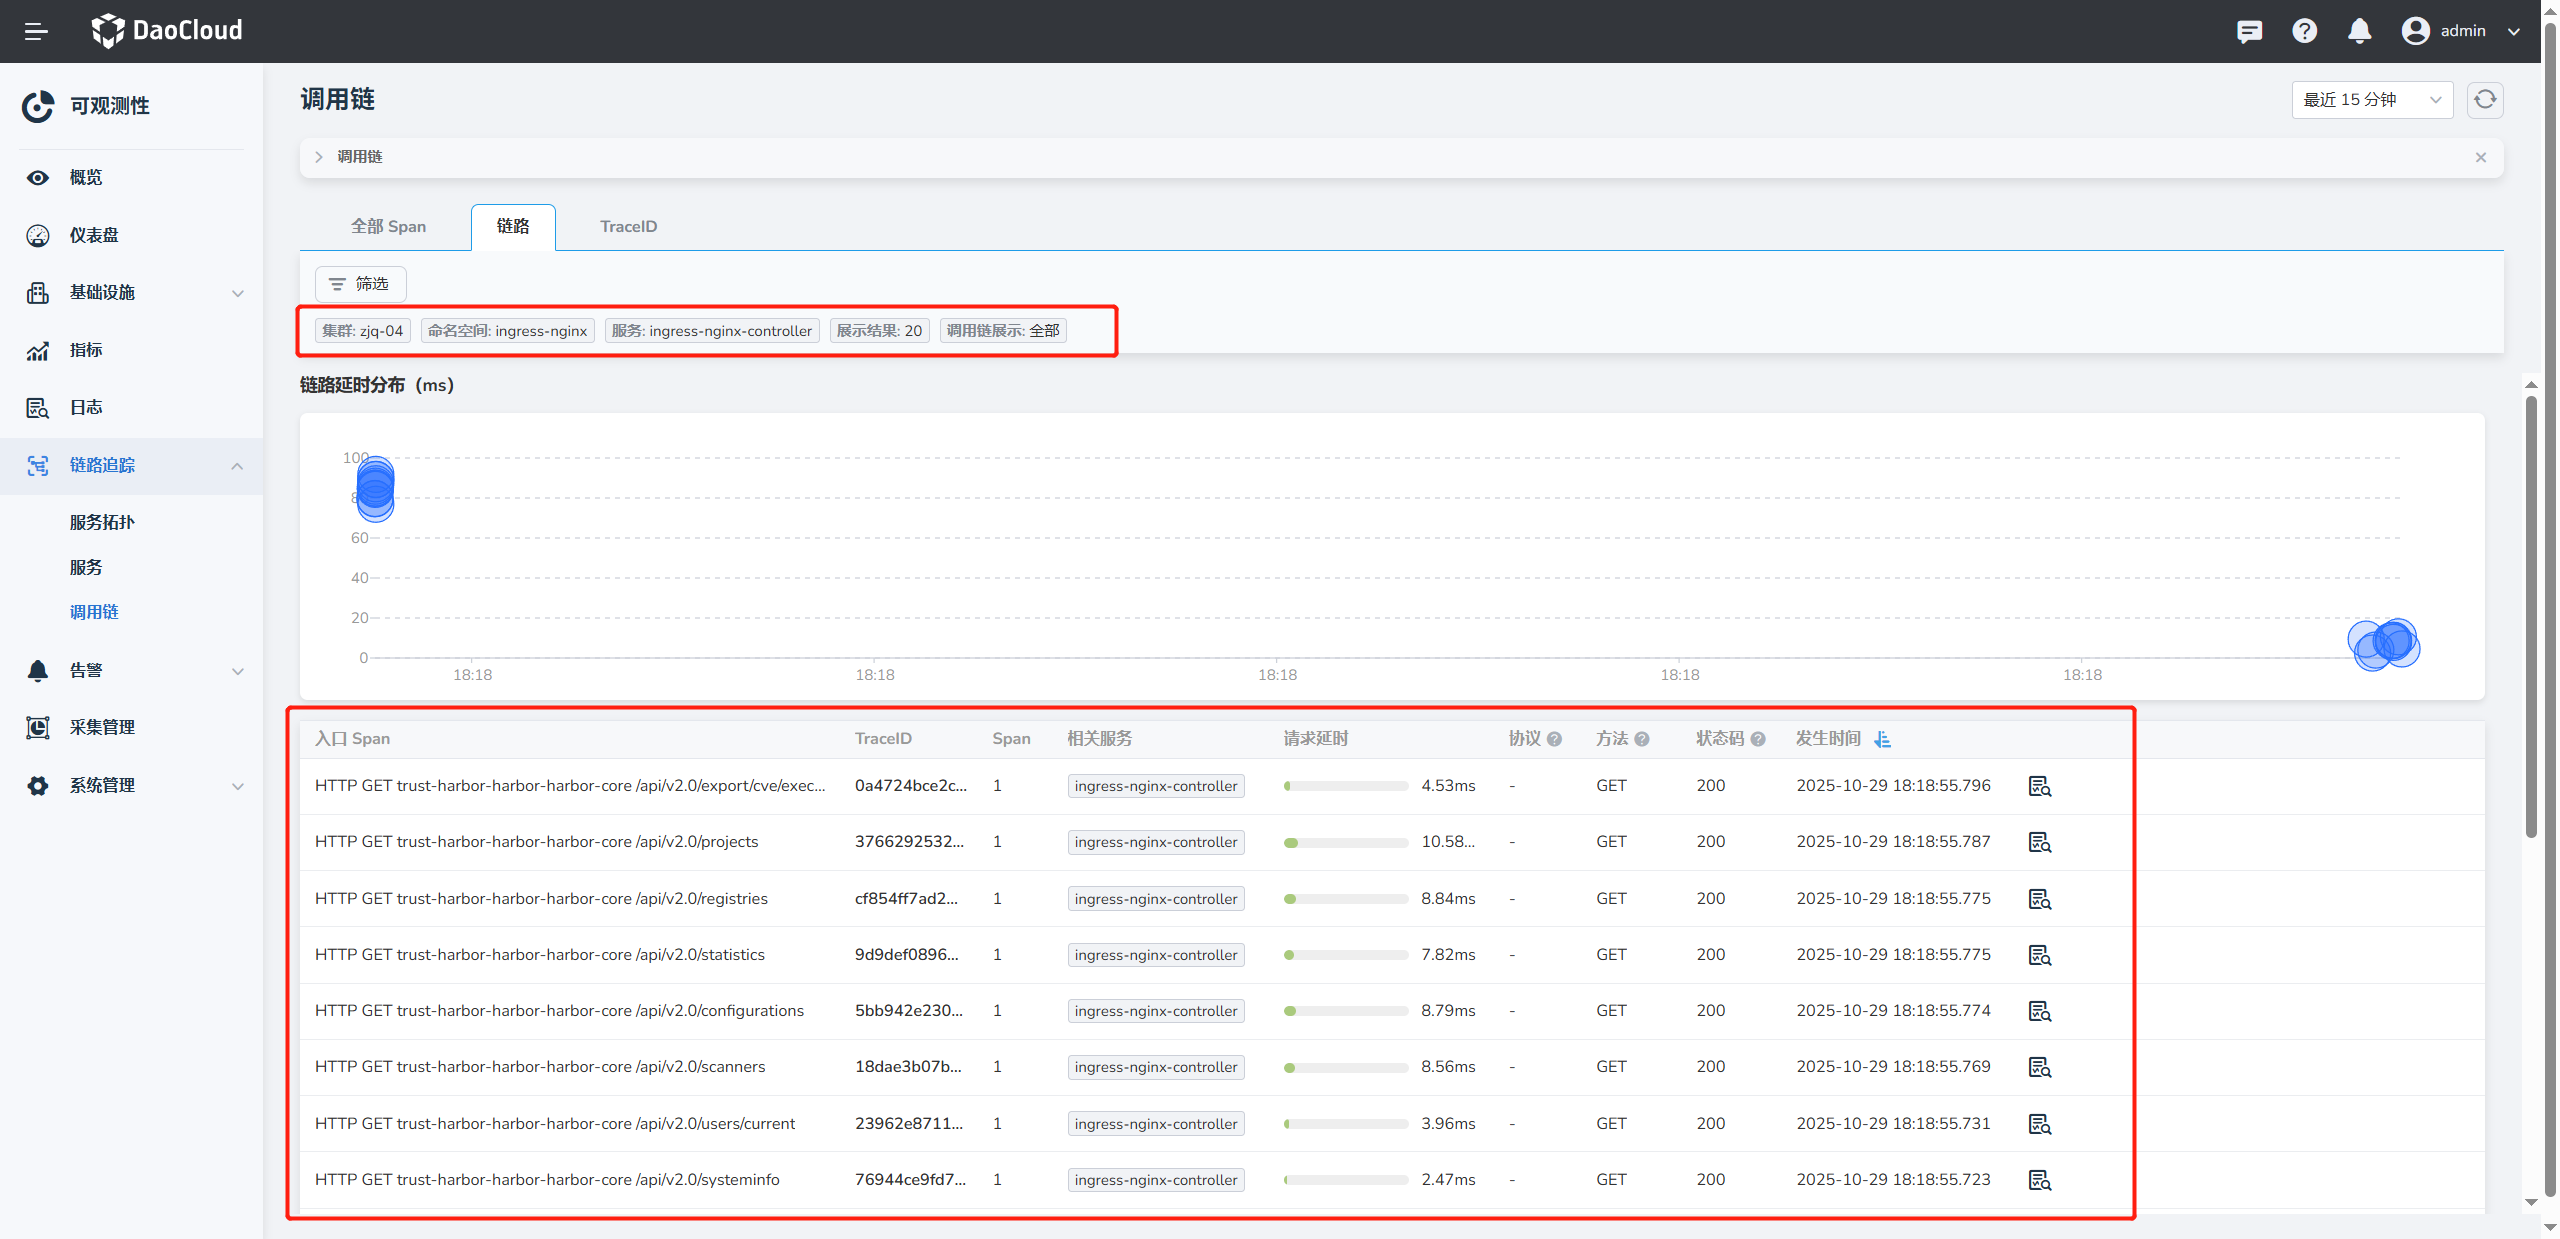
After the configuration is complete, all traces passing through ingress-nginx can be observed.
References
- Enable opentelemetry in Ingress-Nginx (official demo)
- Configuration parameters of the nginx OTel module in Ingress-Nginx
- Configmap parameters in Ingress-Nginx