Kafka + Elasticsearch Stream Architecture for Handling Large-Scale Logs
As businesses grow, the amount of log data generated by applications increases significantly. To ensure that systems can properly collect and analyze massive amounts of log data, it is common practice to introduce a streaming architecture using Kafka to handle asynchronous data collection. The collected log data flows through Kafka and is consumed by corresponding components, which then store the data into Elasticsearch for visualization and analysis using Insight.
This article will introduce two solutions:
- Fluentbit + Kafka + Logstash + Elasticsearch
- Fluentbit + Kafka + Vector + Elasticsearch
Once we integrate Kafka into the logging system, the data flow diagram looks as follows:
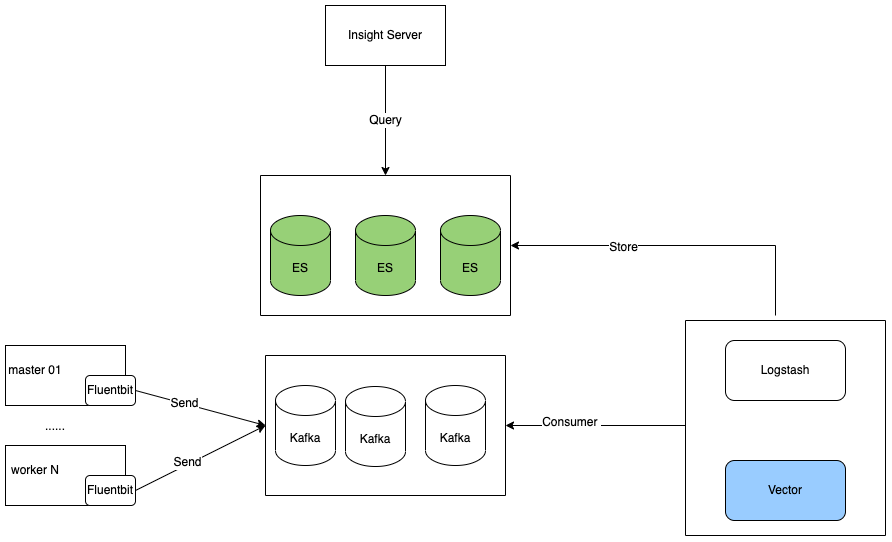
Both solutions share similarities but differ in the component used to consume Kafka data. To ensure compatibility with Insight's data analysis, the format of the data consumed from Kafka and written into Elasticsearch should be consistent with the data directly written by Fluentbit to Elasticsearch.
Let's first see how Fluentbit writes logs to Kafka:
Modifying Fluentbit Output Configuration
Once the Kafka cluster is ready, we need to modify the content of the insight-system namespace's ConfigMap . We will add three Kafka outputs and comment out the original three Elasticsearch outputs:
Assuming the Kafka Brokers address is: insight-kafka.insight-system.svc.cluster.local:9092
    [OUTPUT]
        Name        kafka
        Match_Regex (?:kube|syslog)\.(.*)
        Brokers     insight-kafka.insight-system.svc.cluster.local:9092
        Topics      insight-logs
        format      json
        timestamp_key @timestamp
        rdkafka.batch.size 65536
        rdkafka.compression.level 6
        rdkafka.compression.type lz4
        rdkafka.linger.ms 0
        rdkafka.log.connection.close false
        rdkafka.message.max.bytes 2.097152e+06
        rdkafka.request.required.acks 1
    [OUTPUT]
        Name        kafka
        Match_Regex (?:skoala-gw)\.(.*)
        Brokers     insight-kafka.insight-system.svc.cluster.local:9092
        Topics      insight-gw-skoala
        format      json
        timestamp_key @timestamp
        rdkafka.batch.size 65536
        rdkafka.compression.level 6
        rdkafka.compression.type lz4
        rdkafka.linger.ms 0
        rdkafka.log.connection.close false
        rdkafka.message.max.bytes 2.097152e+06
        rdkafka.request.required.acks 1
    [OUTPUT]
        Name        kafka
        Match_Regex (?:kubeevent)\.(.*)
        Brokers     insight-kafka.insight-system.svc.cluster.local:9092
        Topics      insight-event
        format      json
        timestamp_key @timestamp
        rdkafka.batch.size 65536
        rdkafka.compression.level 6
        rdkafka.compression.type lz4
        rdkafka.linger.ms 0
        rdkafka.log.connection.close false
        rdkafka.message.max.bytes 2.097152e+06
        rdkafka.request.required.acks 1
Next, let's discuss the subtle differences in consuming Kafka data and writing it to Elasticsearch. As mentioned at the beginning of this article, we will explore Logstash and Vector as two ways to consume Kafka data.
Consuming Kafka and Writing to Elasticsearch
Assuming the Elasticsearch address is: https://mcamel-common-es-cluster-es-http.mcamel-system:9200
Using Logstash for Consumption
If you are familiar with the Logstash technology stack, you can continue using this approach.
When deploying Logstash via Helm, you can add the following pipeline in the logstashPipeline section:
replicas: 3
resources:
  requests:
    cpu: 100m
    memory: 1536Mi
  limits:
    cpu: 1000m
    memory: 1536Mi
logstashConfig:
  logstash.yml: |
    http.host: 0.0.0.0
    xpack.monitoring.enabled: false
logstashPipeline:
  insight-event.conf: |
    input {
      kafka {
        add_field => {"kafka_topic" => "insight-event"}
        topics => ["insight-event"]
        bootstrap_servers => "172.30.120.189:32082" # kafka的ip 和端口
        enable_auto_commit => true
        consumer_threads => 1                       # 对应 partition 的数量
        decorate_events => true
        codec => "plain"
      }
    }

    filter {
      mutate { gsub => [ "message", "@timestamp", "_@timestamp"] }
      json {source => "message"}
      date {
        match => [ "_@timestamp", "UNIX" ]
        remove_field => "_@timestamp"
        remove_tag => "_timestampparsefailure"
      }
      mutate {
        remove_field => ["event", "message"]
      }
    }

    output {
      if [kafka_topic] == "insight-event" {
        elasticsearch {
          hosts => ["https://172.30.120.201:32427"] # elasticsearch 地址
          user => 'elastic'                         # elasticsearch 用户名
          ssl => 'true'
          password => '0OWj4D54GTH3xK06f9Gg01Zk'    # elasticsearch 密码
          ssl_certificate_verification => 'false'
          action => "create"
          index => "insight-es-k8s-event-logs-alias"
          data_stream => "false"
        }
      }
    }
  insight-gw-skoala.conf: |
    input {
      kafka {
        add_field => {"kafka_topic" => "insight-gw-skoala"}
        topics => ["insight-gw-skoala"]
        bootstrap_servers => "172.30.120.189:32082"
        enable_auto_commit => true
        consumer_threads => 1
        decorate_events => true
        codec => "plain"
      }
    }

    filter {
      mutate { gsub => [ "message", "@timestamp", "_@timestamp"] }
      json {source => "message"}
      date {
        match => [ "_@timestamp", "UNIX" ]
        remove_field => "_@timestamp"
        remove_tag => "_timestampparsefailure"
      }
      mutate {
        remove_field => ["event", "message"]
      }
    }

    output {
      if [kafka_topic] == "insight-gw-skoala" {
        elasticsearch {
          hosts => ["https://172.30.120.201:32427"]
          user => 'elastic'
          ssl => 'true'
          password => '0OWj4D54GTH3xK06f9Gg01Zk'
          ssl_certificate_verification => 'false'
          action => "create"
          index => "skoala-gw-alias"
          data_stream => "false"
        }
      }
    }
  insight-logs.conf: |
    input {
      kafka {
        add_field => {"kafka_topic" => "insight-logs"}
        topics => ["insight-logs"]
        bootstrap_servers => "172.30.120.189:32082"
        enable_auto_commit => true
        consumer_threads => 1
        decorate_events => true
        codec => "plain"
      }
    }

    filter {
      mutate { gsub => [ "message", "@timestamp", "_@timestamp"] }
      json {source => "message"}
      date {
        match => [ "_@timestamp", "UNIX" ]
        remove_field => "_@timestamp"
        remove_tag => "_timestampparsefailure"
      }
      mutate {
        remove_field => ["event", "message"]
      }
    }

    output {
      if [kafka_topic] == "insight-logs" {
        elasticsearch {
          hosts => ["https://172.30.120.201:32427"]
          user => 'elastic'
          ssl => 'true'
          password => '0OWj4D54GTH3xK06f9Gg01Zk'
          ssl_certificate_verification => 'false'
          action => "create"
          index => "insight-es-k8s-logs-alias"
          data_stream => "false"
        }
      }
    }
Consumption with Vector
If you are familiar with the Vector technology stack, you can continue using this approach.
When deploying Vector via Helm, you can reference a ConfigMap with the following rules:
metadata:
  name: vector
apiVersion: v1
data:
  aggregator.yaml: |
    api:
      enabled: true
      address: '0.0.0.0:8686'
    sources:
      insight_logs_kafka:
        type: kafka
        bootstrap_servers: 'insight-kafka.insight-system.svc.cluster.local:9092'
        group_id: consumer-group-insight
        topics:
          - insight-logs
      insight_event_kafka:
        type: kafka
        bootstrap_servers: 'insight-kafka.insight-system.svc.cluster.local:9092'
        group_id: consumer-group-insight
        topics:
          - insight-event
      insight_gw_skoala_kafka:
        type: kafka
        bootstrap_servers: 'insight-kafka.insight-system.svc.cluster.local:9092'
        group_id: consumer-group-insight
        topics:
          - insight-gw-skoala
    transforms:
      insight_logs_remap:
        type: remap
        inputs:
          - insight_logs_kafka
        source: |2
              . = parse_json!(string!(.message))
              .@timestamp = now()
      insight_event_kafka_remap:
        type: remap
        inputs:
          - insight_event_kafka
          - insight_gw_skoala_kafka
        source: |2
              . = parse_json!(string!(.message))
              .@timestamp = now()
      insight_gw_skoala_kafka_remap:
        type: remap
        inputs:
          - insight_gw_skoala_kafka
        source: |2
              . = parse_json!(string!(.message))
              .@timestamp = now()
    sinks:
      insight_es_logs:
        type: elasticsearch
        inputs:
          - insight_logs_remap
        api_version: auto
        auth:
          strategy: basic
          user: elastic
          password: 8QZJ656ax3TXZqQh205l3Ee0
        bulk:
          index: insight-es-k8s-logs-alias-1418
        endpoints:
          - 'https://mcamel-common-es-cluster-es-http.mcamel-system:9200'
        tls:
          verify_certificate: false
          verify_hostname: false
      insight_es_event:
        type: elasticsearch
        inputs:
          - insight_event_kafka_remap
        api_version: auto
        auth:
          strategy: basic
          user: elastic
          password: 8QZJ656ax3TXZqQh205l3Ee0
        bulk:
          index: insight-es-k8s-event-logs-alias-1418
        endpoints:
          - 'https://mcamel-common-es-cluster-es-http.mcamel-system:9200'
        tls:
          verify_certificate: false
          verify_hostname: false
      insight_es_gw_skoala:
        type: elasticsearch
        inputs:
          - insight_gw_skoala_kafka_remap
        api_version: auto
        auth:
          strategy: basic
          user: elastic
          password: 8QZJ656ax3TXZqQh205l3Ee0
        bulk:
          index: skoala-gw-alias-1418
        endpoints:
          - 'https://mcamel-common-es-cluster-es-http.mcamel-system:9200'
        tls:
          verify_certificate: false
          verify_hostname: false
Checking if it's Working Properly
You can verify if the configuration is successful by checking if there are new data in the Insight log query interface or observing an increase in the number of indices in Elasticsearch.