Simplifying Trace Data Integration with OpenTelemetry and SkyWalking
This article explains how to seamlessly integrate trace data from SkyWalking into the Insight platform, using OpenTelemetry. With zero code modification required, you can transform your existing SkyWalking trace data and leverage Insight's capabilities.
Understanding the Code
To ensure compatibility with different distributed tracing implementations, OpenTelemetry provides a way to incorporate components that standardize data processing and output to various backends. While Jaeger and Zipkin are already available, we have contributed the SkyWalkingReceiver to the OpenTelemetry community. This receiver has been refined and is now suitable for use in production environments without any modifications to your application's code.
Although SkyWalking and OpenTelemetry share similarities, such as using Trace to define a trace and Span to mark the smallest granularity, there are differences in certain details and implementations:
| SkyWalking | OpenTelemetry | |
|---|---|---|
| Data Structure | Span -> Segment -> Trace | Span -> Trace |
| Attribute Information | Tags | Attributes |
| Application Time | Logs | Events |
| Reference Relationship | References | Links |
Now, let's discuss the steps involved in converting SkyWalking Trace to OpenTelemetry Trace. The main tasks include:
-
Constructing OpenTelemetry's TraceId and SpanId
-
Constructing OpenTelemetry's ParentSpanId
-
Retaining SkyWalking's original TraceId, SegmentId, and SpanId in OpenTelemetry Spans
First, let's look at how to construct the TraceId and SpanId for OpenTelemetry. Both SkyWalking and OpenTelemetry use TraceId to connect distributed service calls and use SpanId to mark each Span, but there are significant differences in the implementation specifications:
Info
View GitHub for code implementation:
Specifically, the possible formats for SkyWalking TraceId and SegmentId are as follows:

In the OpenTelemetry protocol, a Span is unique across all Traces, while in SkyWalking, a Span is only unique within each Segment. This means that to uniquely identify a Span in SkyWalking, it is necessary to combine the SegmentId and SpanId, and convert it to the SpanId in OpenTelemetry.
Info
View GitHub for code implementation:
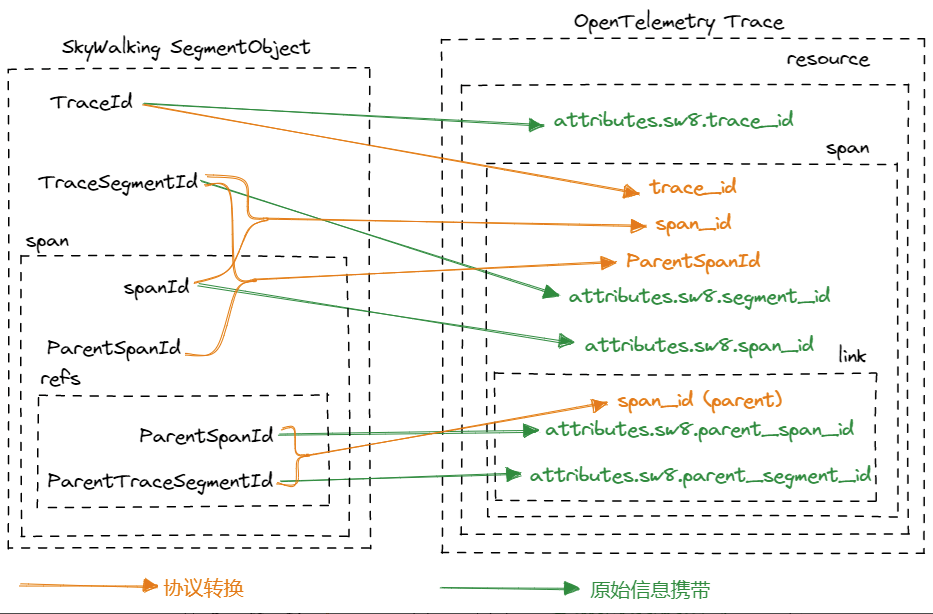
Next, let's see how to construct the ParentSpanId for OpenTelemetry. Within a Segment, the ParentSpanId field in SkyWalking can be directly used to construct the ParentSpanId field in OpenTelemetry. However, when a Trace spans multiple Segments, SkyWalking uses the association information represented by ParentTraceSegmentId and ParentSpanId in the Reference. In this case, the ParentSpanId in OpenTelemetry needs to be constructed using the information in the Reference.
Code implementation can be found on GitHub: Skywalking Receiver
Finally, let's see how to preserve the original TraceId, SegmentId, and SpanId from SkyWalking in the OpenTelemetry Span. We carry these original information to associate the OpenTelemetry TraceId and SpanId displayed in the distributed tracing backend with the SkyWalking TraceId, SegmentId, and SpanId in the application logs. We choose to carry the original TraceId, SegmentId, and ParentSegmentId from SkyWalking to the OpenTelemetry Attributes.
Info
View GitHub for code implementation:
After this series of conversions, we have fully transformed the SkyWalking Segment Object into an OpenTelemetry Trace, as shown in the following diagram:

Deploying the Demo
To demonstrate the complete process of collecting and displaying SkyWalking tracing data using OpenTelemetry, we will use a demo application.
First, deploy the OpenTelemetry Agent and enable the following configuration to ensure compatibility with the SkyWalking protocol:
# otel-agent config
receivers:
  skywalking:
    protocols:
      grpc:
        endpoint: 0.0.0.0:11800 # Receive trace data reported by the SkyWalking Agent
      http:
        endpoint: 0.0.0.0:12800 # Receive trace data reported from the front-end / nginx or other HTTP protocols
service:
  pipelines:
    traces:
      receivers: [skywalking]

# otel-agent service yaml
spec:
  ports:
    - name: sw-http
      port: 12800
      protocol: TCP
      targetPort: 12800
    - name: sw-grpc
      port: 11800
      protocol: TCP
      targetPort: 11800
Next, modify the connection of your business application from the SkyWalking OAP Service (e.g., oap:11800) to the OpenTelemetry Agent Service (e.g., otel-agent:11800). This will allow you to start receiving trace data from the SkyWalking probe using OpenTelemetry.
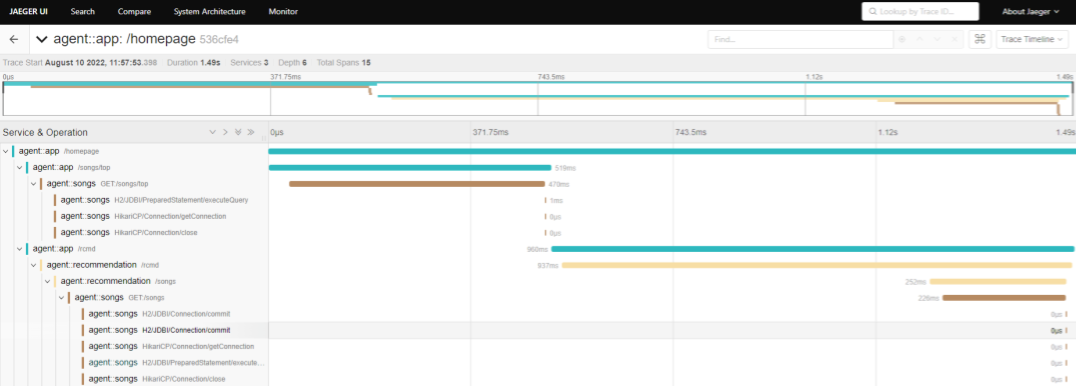
To demonstrate the entire process, we will use the SkyWalking-showcase Demo. This demo utilizes the SkyWalking Agent for tracing, and after being processed by OpenTelemetry, the final results are presented using Jaeger:

From the architecture diagram of the SkyWalking Showcase, we can observe that the data remains intact even after standardization by OpenTelemetry. In this trace, the request starts from app/homepage, then two requests /rcmd and /songs/top are initiated simultaneously within the app, distributed to the recommendation and songs services, and finally reach the database for querying, completing the entire request chain.

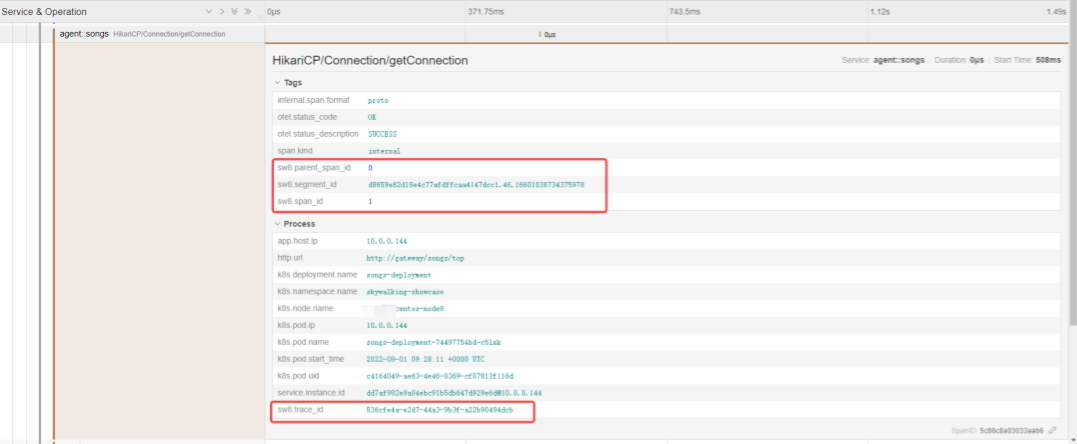
Additionally, you can view the original SkyWalking Id information on the Jaeger page, which facilitates correlation with application logs:

By following these steps, you can seamlessly integrate SkyWalking trace data into OpenTelemetry and leverage the capabilities of the Insight platform.