Import Custom Dashboards
By using Grafana CRD, you can incorporate the management and deployment of dashboards into the lifecycle management of Kubernetes. This enables version control, automated deployment, and cluster-level management of dashboards. This page describes how to import custom dashboards using CRD and ConfigMaps.
Insight v0.40.0 now supports importing dashboards using the latest GrafanaDashboard (v1beta1) CRD from the Grafana community.
Using v1beta1 CRD
-
Log in to the DCE 5.0 platform and go to Container Management . Select the kpanda-global-cluster from the cluster list.
-
Choose Custom Resources from the left navigation bar. Look for the grafana.integreatly.org file in the list and click it to view the details.
-
Click YAML Create and use the following template. Replace the dashboard JSON in the Json field.
- metadata.name :Provide a name for the dashboard.
- metadata.namespace :Specify the target namespace.
- metadata.labels :Mandatory, operator.insight.io/managed-by: insight .
- spec.allowCrossNamespaceImport :Mandatory, true .
- spec.instanceSelector.matchLabels :Mandatory,operator.insight.io/managed-by: insight .
apiVersion: grafana.integreatly.org/v1beta1 kind: GrafanaDashboard metadata: labels: operator.insight.io/managed-by: insight name: sample-dashboard namespace: insight-system spec: allowCrossNamespaceImport: true instanceSelector: matchLabels: operator.insight.io/managed-by: insight json: > { "id": null, "title": "Simple Dashboard", "tags": [], "style": "dark", "timezone": "browser", "editable": true, "hideControls": false, "graphTooltip": 1, "panels": [], "time": { "from": "now-6h", "to": "now" }, "timepicker": { "time_options": [], "refresh_intervals": [] }, "templating": { "list": [] }, "annotations": { "list": [] }, "refresh": "5s", "schemaVersion": 17, "version": 0, "links": [] } -
After clicking OK , wait for a while to view the newly imported dashboard in Dashboard .
Using v1alpha1 CRD
Currently, users can still import dashboards using the old version of CRD:
- namespace : Specify the target namespace.
- name : Provide a name for the dashboard.
- label : Mandatory. Set the label as operator.insight.io/managed-by: insight .
apiVersion: integreatly.org/v1alpha1
kind: GrafanaDashboard
metadata:
  labels:
    app: insight-grafana-operator
    operator.insight.io/managed-by: insight
  name: sample-dashboard
  namespace: insight-system
spec:
  json: >
    {
      "id": null,
      "title": "Simple Dashboard",
      "tags": [],
      "style": "dark",
      "timezone": "browser",
      "editable": true,
      "hideControls": false,
      "graphTooltip": 1,
      "panels": [],
      "time": {
        "from": "now-6h",
        "to": "now"
      },
      "timepicker": {
        "time_options": [],
        "refresh_intervals": []
      },
      "templating": {
        "list": []
      },
      "annotations": {
        "list": []
      },
      "refresh": "5s",
      "schemaVersion": 17,
      "version": 0,
      "links": []
    }
The Grafana Deployment in Insight v0.40.x will include a dashboard-discover sidecar, which is used to load GrafanaDashboard(v1alpha1) resources and ConfigMaps into the directory specified by the Grafana dashboard provider (/var/lib/grafana/plugins/dashboards).
The architecture diagram of dashboard-discover is as follows:
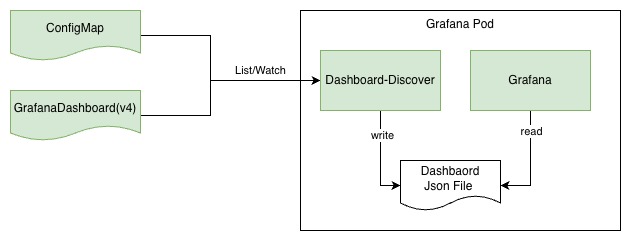
The watched resources require the labels below:
-
GrafanaDashboard(v1alpha1)
The dashboard-discover sidecar will watch for GrafanaDashboard(v1alpha1) resources across all namespaces in the cluster that have the label:
operator.insight.io/managed-by=insight, and write their JSON content into the/var/lib/grafana/plugins/dashboardsdirectory of the Grafana container. -
ConfigMap
The dashboard-discover sidecar will watch for ConfigMaps across all namespaces in the cluster that have the labels:
operator.insight.io/managed-by=insight,operator.insight.io/dashboard=true, and write all content under their data field into the/var/lib/grafana/plugins/dashboardsdirectory of the Grafana container.apiVersion: v1 kind: ConfigMap metadata: labels: operator.insight.io/managed-by: 'insight' operator.insight.io/dashboard: 'true' operator.insight.io/dashboard-folder: 'you-folder' name: sample-dashboard namespace: default data: sample-dashboard.json: > { "id": null, "title": "Simple Dashboard", "tags": [], "style": "dark", "timezone": "browser", "editable": true, "hideControls": false, "graphTooltip": 1, "panels": [], "time": { "from": "now-6h", "to": "now" }, "timepicker": { "time_options": [], "refresh_intervals": [] }, "templating": { "list": [] }, "annotations": { "list": [] }, "refresh": "5s", "schemaVersion": 17, "version": 0, "links": [] }
If you need to store JSON files in a specific folder, you can add the following label to the corresponding resource:
operator.insight.io/dashboard-folder=your-folder
Info
If you need to customize the dashboard, refer to Add Dashboard Panel.
Notice
In version v0.40.0, Grafana has been upgraded from 9.3.14 to 12.1.3. Grafana 12.1.3 has completely removed support for AngularJS and prioritized React instead. For details, refer to the community announcement.
Dashboards maintained by Insight and other gproduct have been automatically migrated and are ready to use out of the box. For customer-maintained dashboards, Grafana 12.1.3 provides automatic migration support for some core pre-installed AngularJS panels. When a customer opens a custom dashboard in Grafana 12.1.3 for the first time, Grafana will automatically trigger the migration. After migration is complete, be sure to click the 「Save」 button on the dashboard to save changes, preventing repeated migrations on each load.
If AngularJS panel migration is not completed, the following issues will occur in Grafana 12.1.3 and later versions:
- Plugins dependent on AngularJS will fail to load and will not display as installed in the plugin directory.
- Configured AngularJS data sources will not appear in the data source list.
-
Original AngularJS panels in the dashboard will show error messages such as
Error loading: plugin_nameorPanel plugin not found: plugin_name; see the figure below: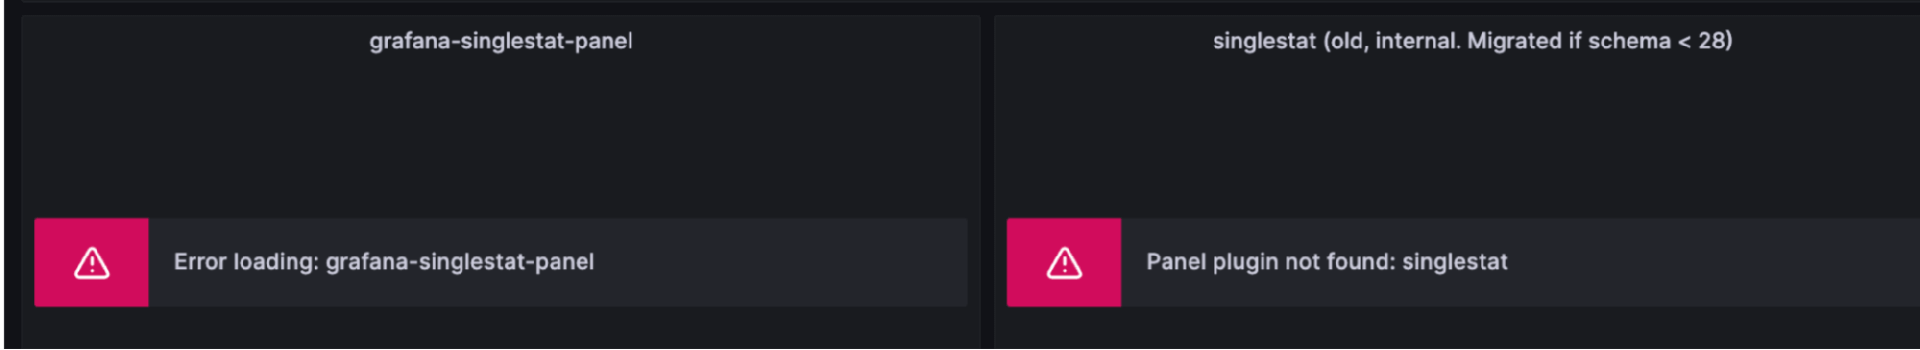
Similar panels or plugins can be manually replaced.
-
Original data sources in the dashboard will be lost, with errors such as
Datasource XXX was not found; see the figure below: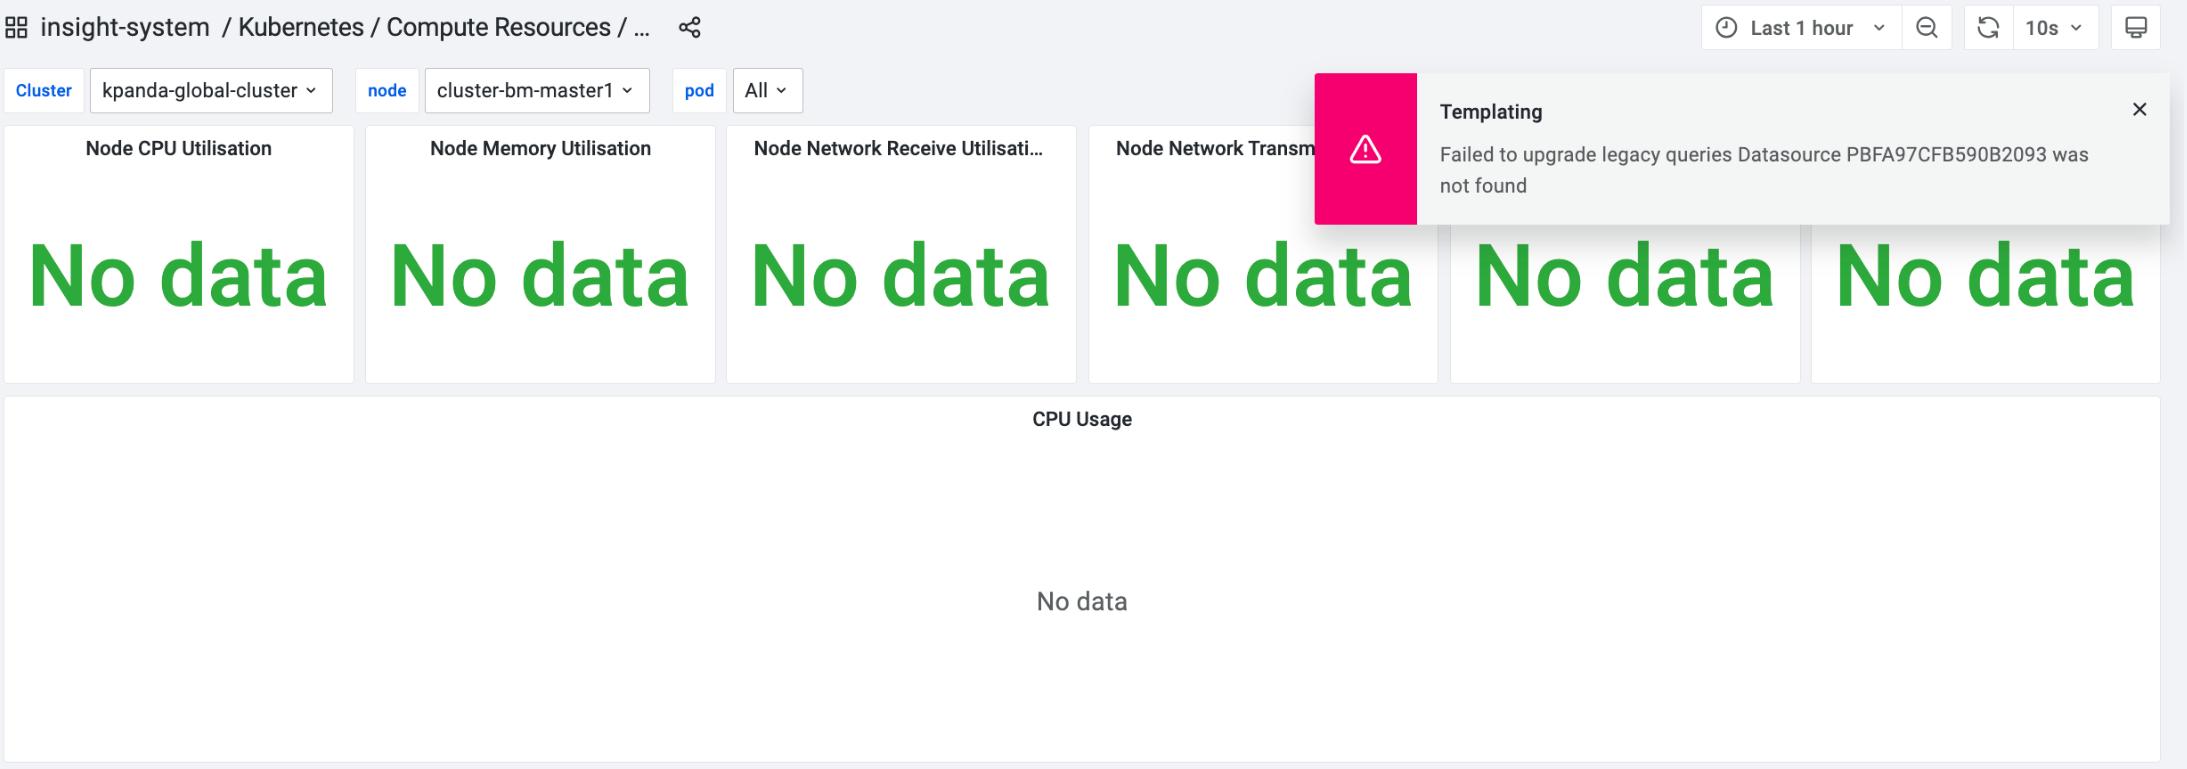
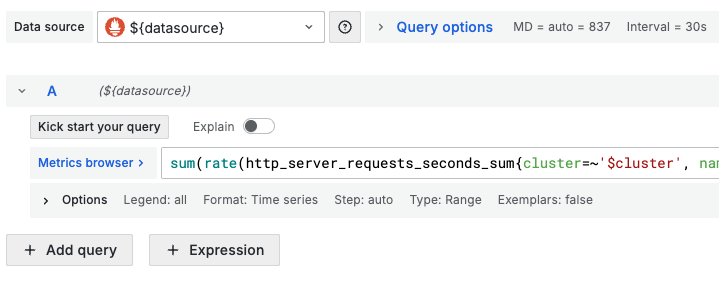
You can manually create a
Datasource variable: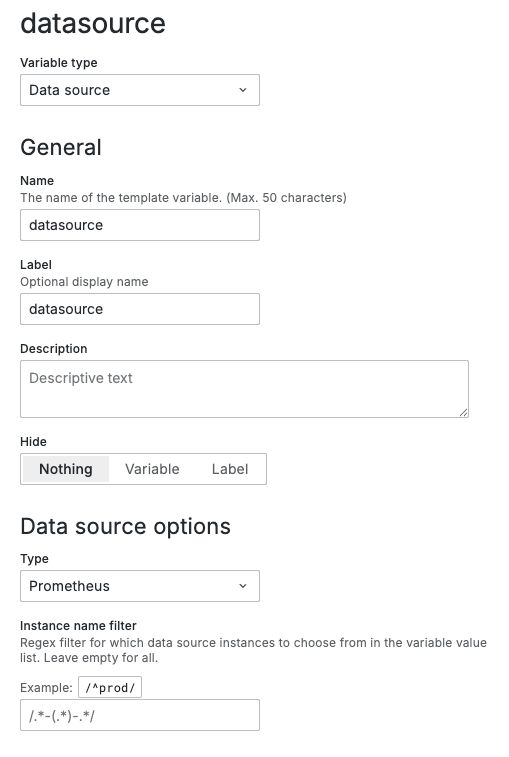
Then apply it in the panel: