Overview
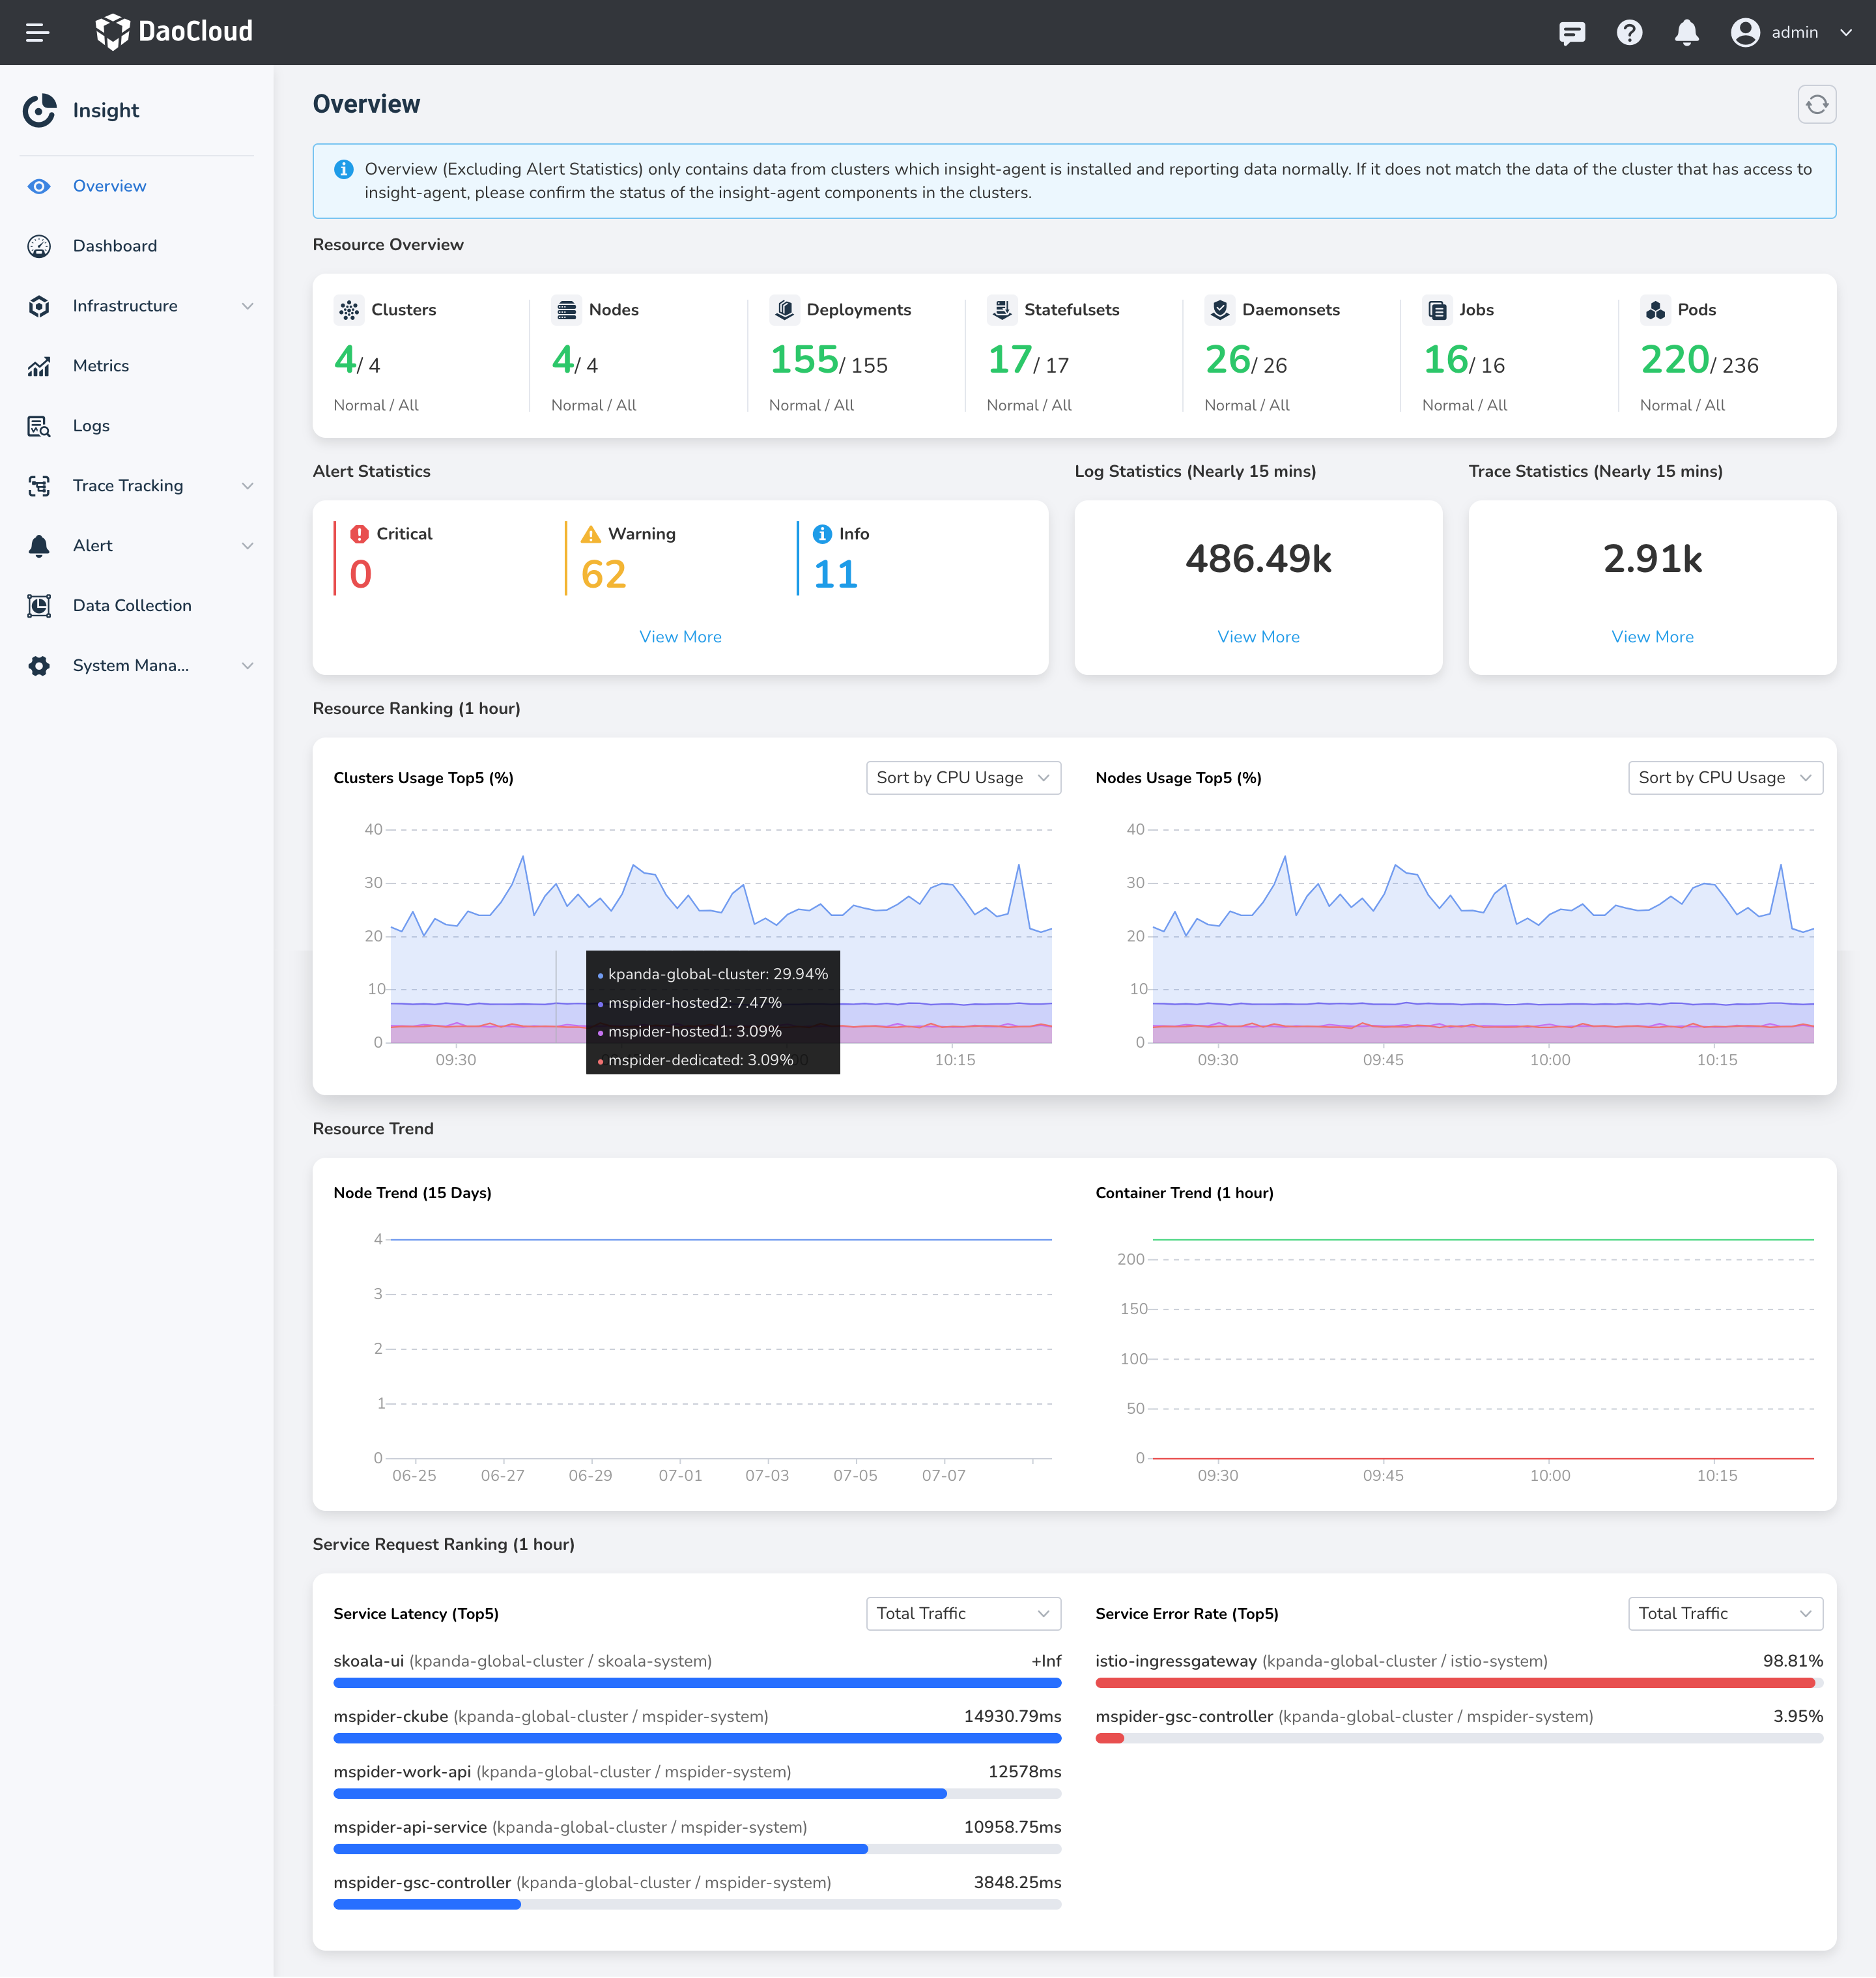
Insight only collects data from clusters that have insight-agent installed and running in a normal state. The overview provides an overview of resources across multiple clusters:
- Alert Statistics: Provides statistics on active alerts across all clusters.
- Resource Consumption: Displays the resource usage trends for the top 5 clusters and nodes in the past hour, based on CPU usage, memory usage, and disk usage.
- By default, the sorting is based on CPU usage. You can switch the metric to sort clusters and nodes.
- Resource Trends: Shows the trends in the number of nodes over the past 15 days and the running trend of pods in the last hour.
- Service Requests Ranking: Displays the top 5 services with the highest request latency and error rates, along with their respective clusters and namespaces in the multi-cluster environment.
Operation procedure
Select Overview in the left navigation bar to enter the details page.
