Service Map
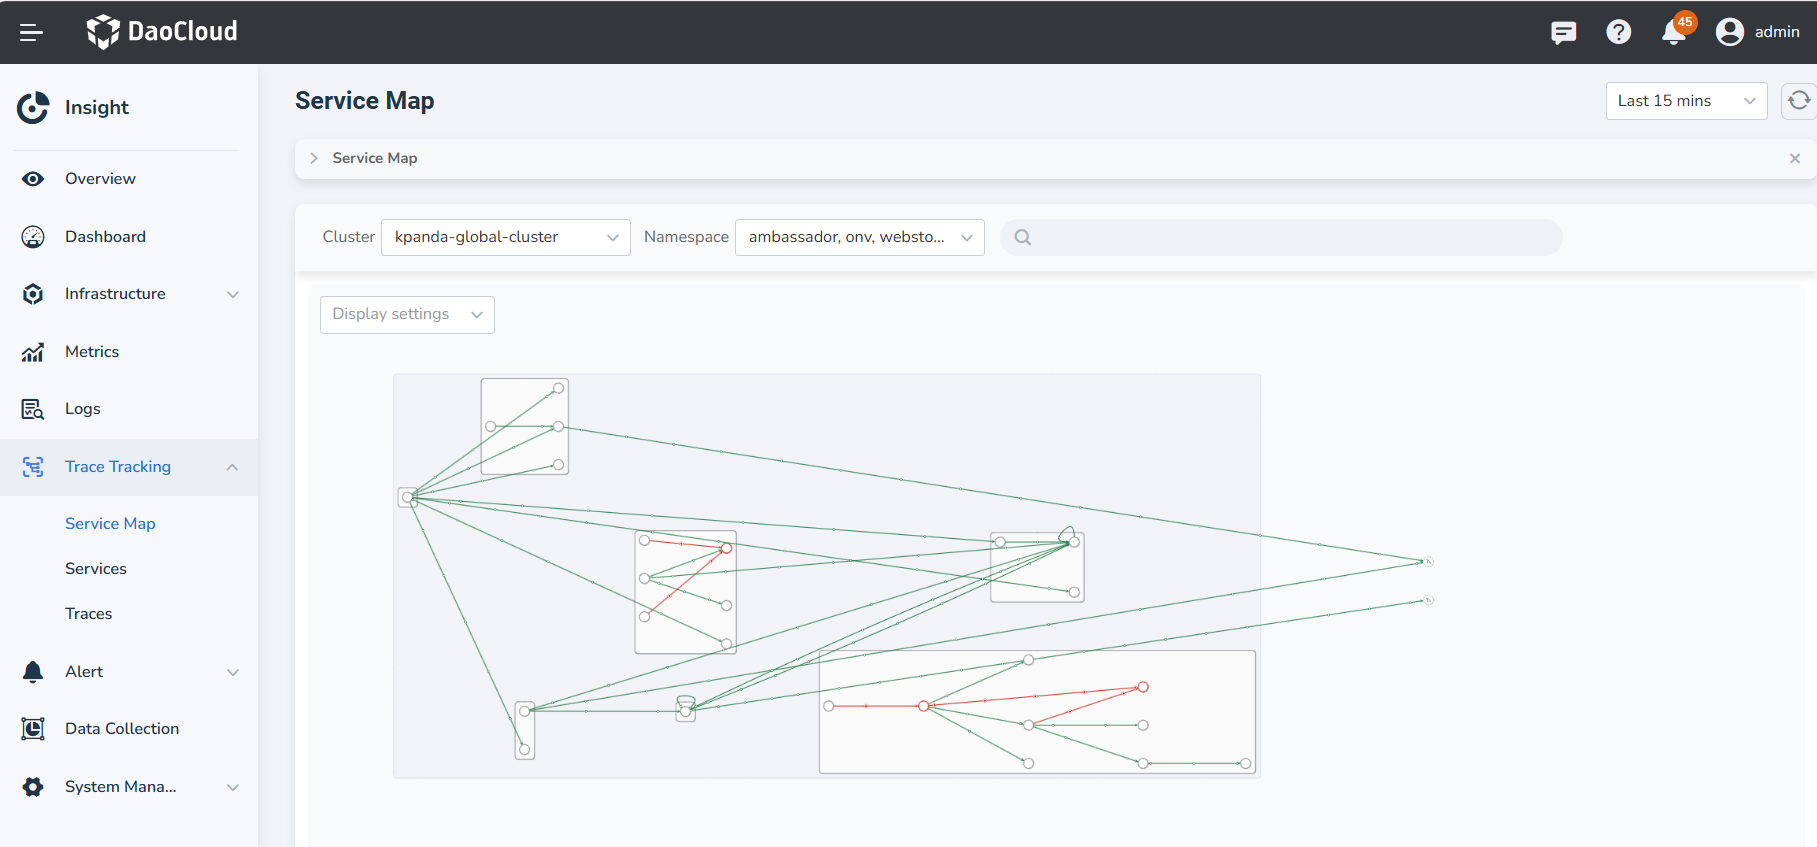
Service map is a visual representation of the connections, communication, and dependencies between services. It provides insights into the service-to-service interactions, allowing you to view the calls and performance of services within a specified time range. The connections between nodes in the topology map represent the existence of service-to-service calls during the queried time period.
Prerequisites
- Insight Agent is installed in the cluster and the applications are in the Running state.
- Services have been instrumented for distributed tracing using Operator or OpenTelemetry SDK.
Steps
-
Go to the Insight product module.
-
Select Tracing -> Service Map from the left navigation bar.
-
In the Service Map, you can perform the following actions:
- Click a node to slide out the details of the service on the right side. Here, you can view metrics such as request latency, throughput, and error rate for the service. Clicking on the service name takes you to the service details page.
- Hover over the connections to view the traffic metrics between the two services.
- Click Display Settings , you can configure the display elements in the service map.
-
In the search box, you can filter the topology data based on service name, node error rate range, and node latency range.
-
Click the Legend button in the bottom-right corner to modify the rendering thresholds defined in the current topology through a temporary configuration. Exiting or closing this page will discard the configuration.
The threshold values must be greater than 0. The value entered first must be smaller than the one entered later. All entered values must fall within the maximum and minimum range.
Other Nodes
In the Service Map, there can be nodes that are not part of the cluster. These external nodes can be categorized into three types:
- Database
- Message Queue
-
Virtual Node
-
If a service makes a request to a Database or Message Queue, these two types of nodes will be displayed by default in the topology map. However, Virtual Nodes represent nodes outside the cluster or services not integrated into the trace, and they will not be displayed by default in the map.
-
When a service makes a request to MySQL, PostgreSQL, or Oracle Database, the detailed database type can be seen in the map.
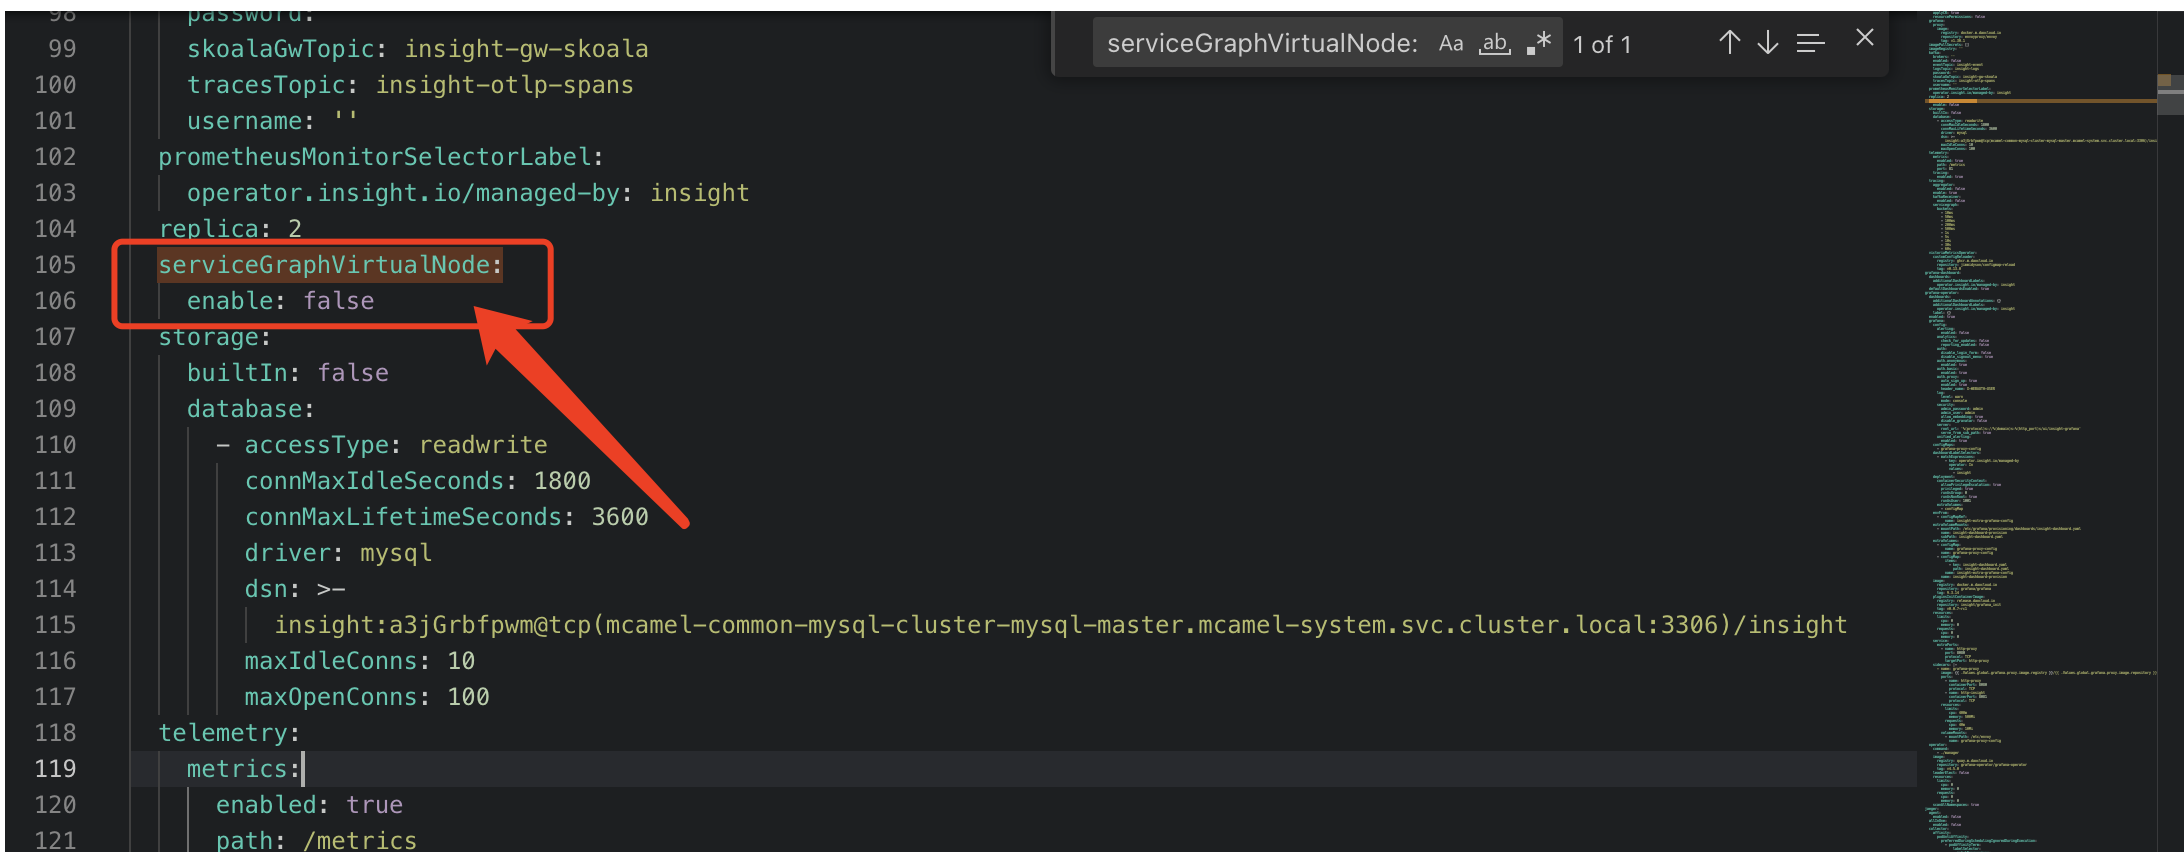
Enabling Virtual Nodes
- Update the
insight-serverchart values, locate the parameter shown in the image below, and changefalsetotrue.
- In the display settings of the service map, check the Virtual Services option to enable it.