Traffic Monitor
The traffic monitor dashboard utilizes native Grafana charts from Istio. Currently, there are four main sections available:
-
Global monitor: Provides statistics for various resources across the entire mesh.
-
Performance monitor: Displays performance metrics for both control plane and data plane components of the mesh. It also includes performance statistics based on component versions.
-
Service monitor: Presents performance statistics for all injected sidecar services within the mesh. It offers multiple filtering options, allowing you to view content based on namespaces, request sources, service versions, and more.
-
Workload monitor: Offers performance statistics for all injected sidecar workloads within the mesh. Similar to service monitor, it provides multiple filtering options based on namespaces, associated services, request sources, service versions, and more.
Additionally, a traffic topology view is available to monitor traffic from different namespaces and collection sources. It includes animated flow visualization, enabling easier observation of dynamic traffic patterns.
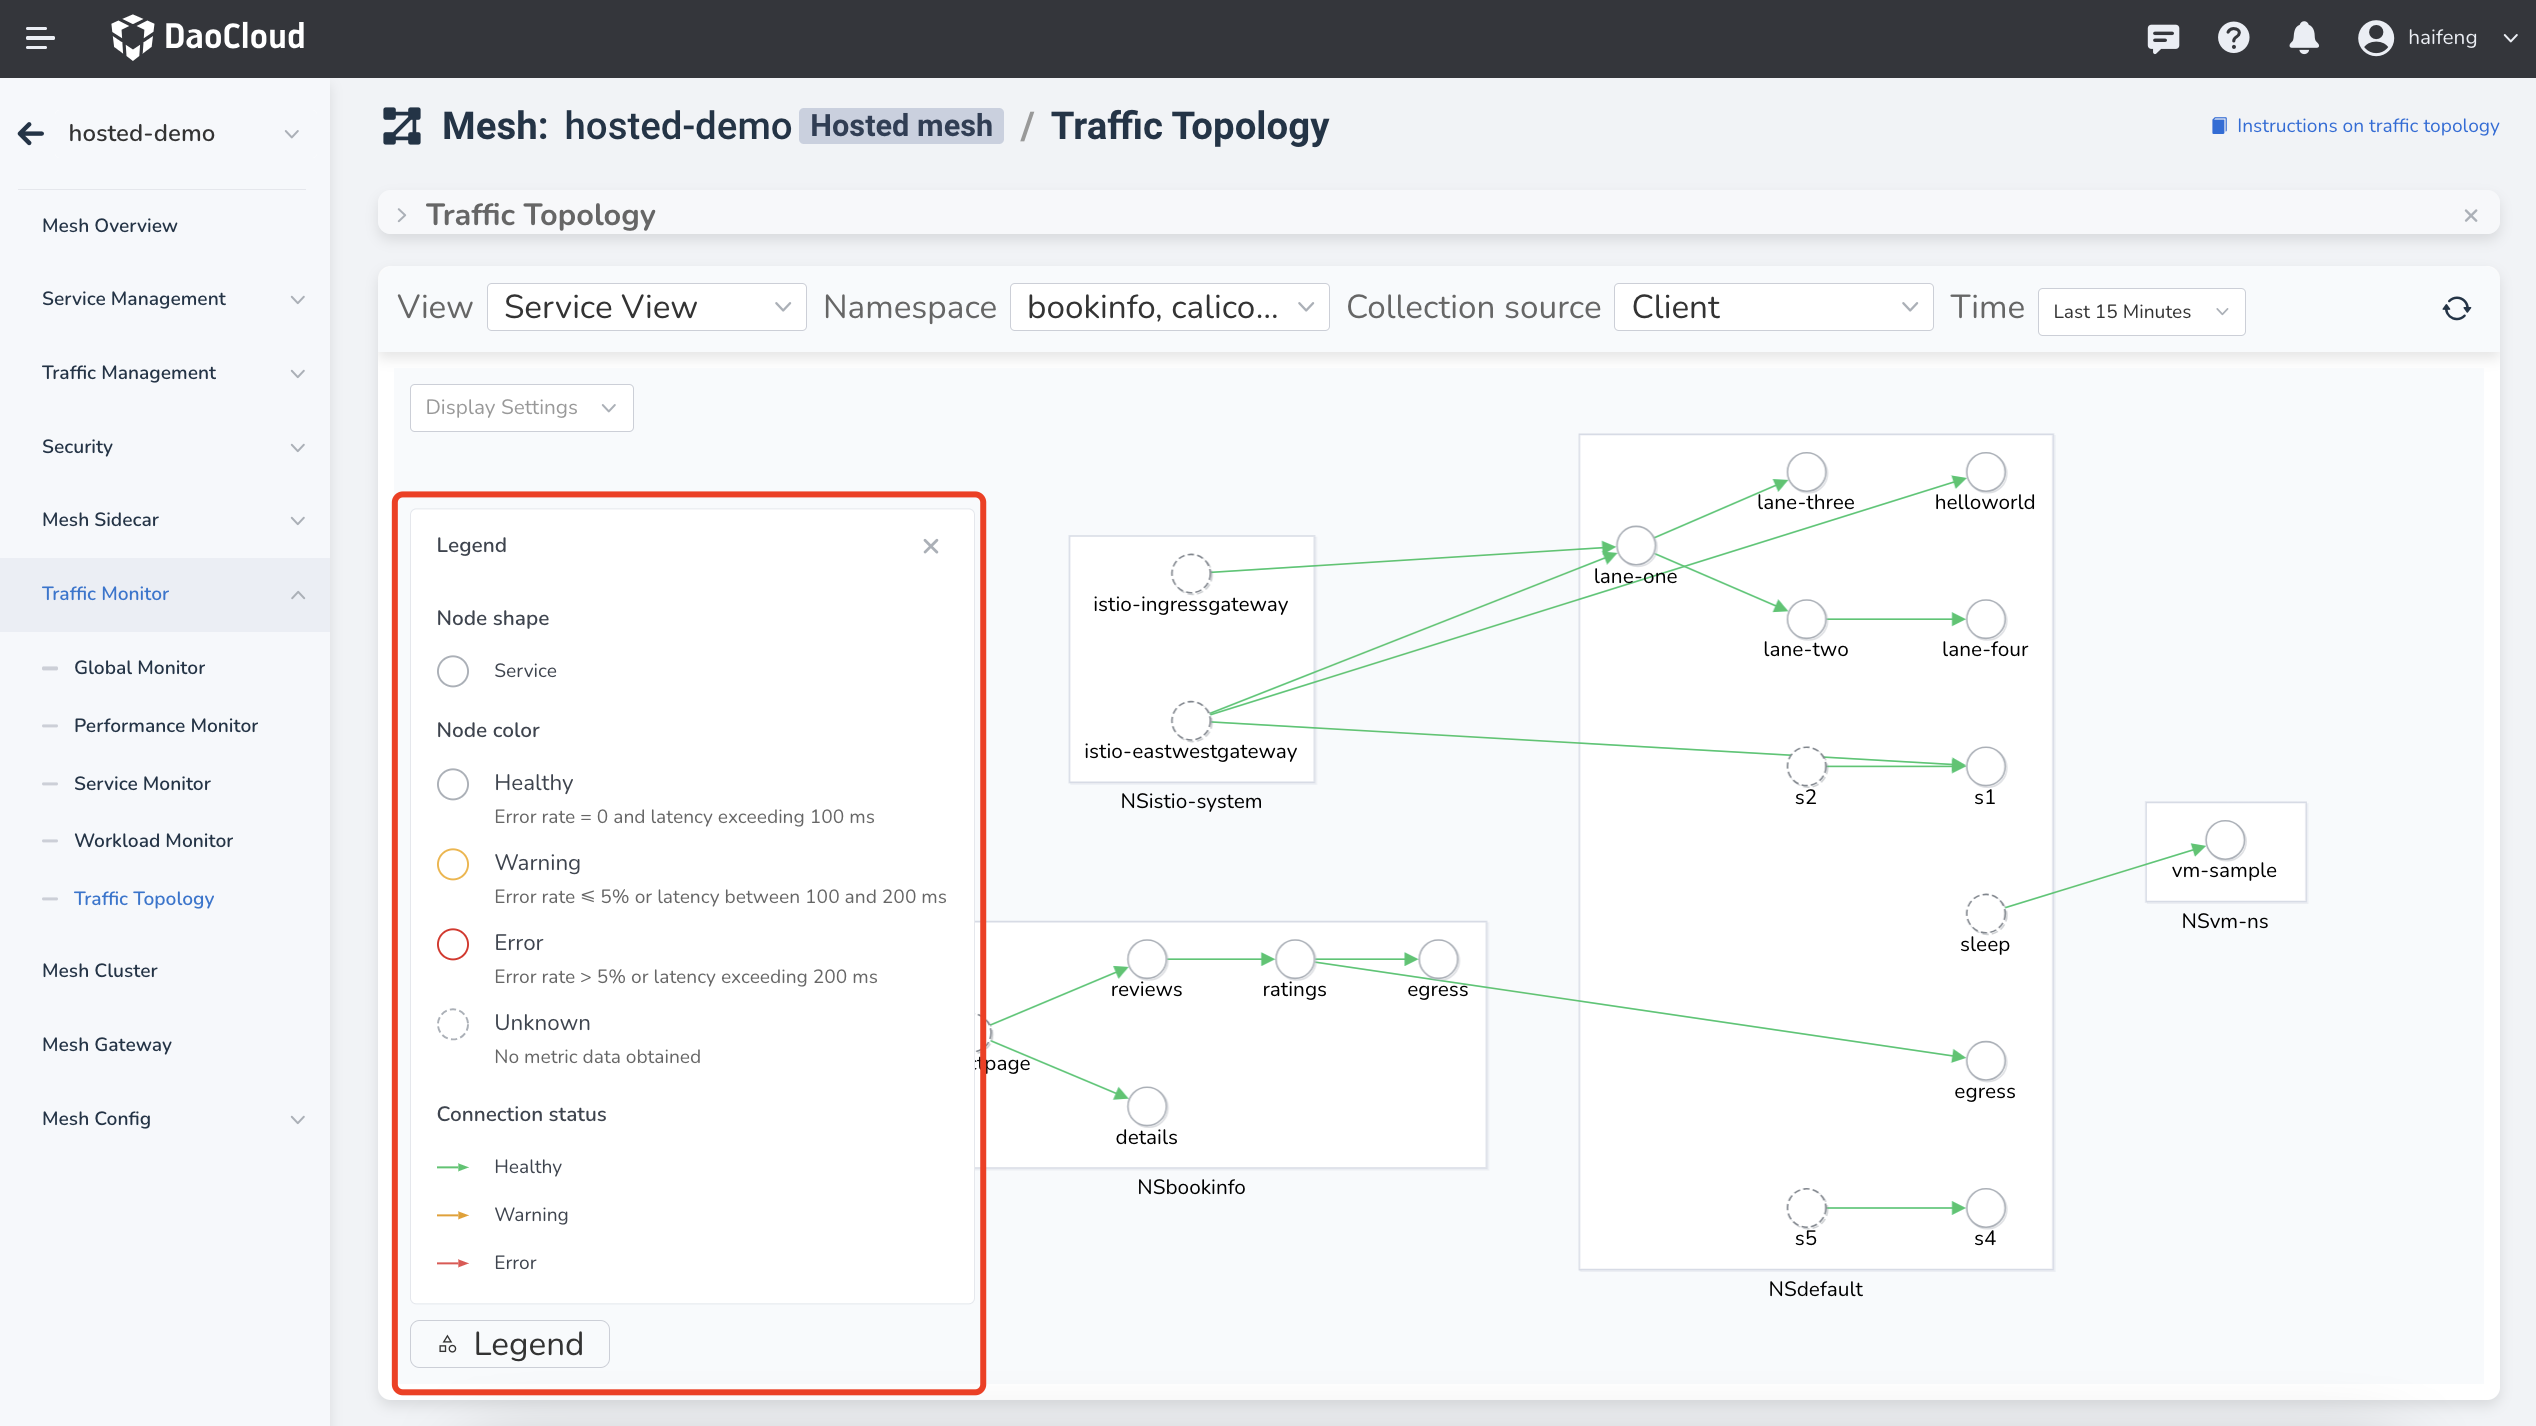
For more information, refer to the Grafana Dashboard documentation in Istio.