Spiderpool RDMA Dashboards
Spiderpool RDMA Node - Node Dashboard
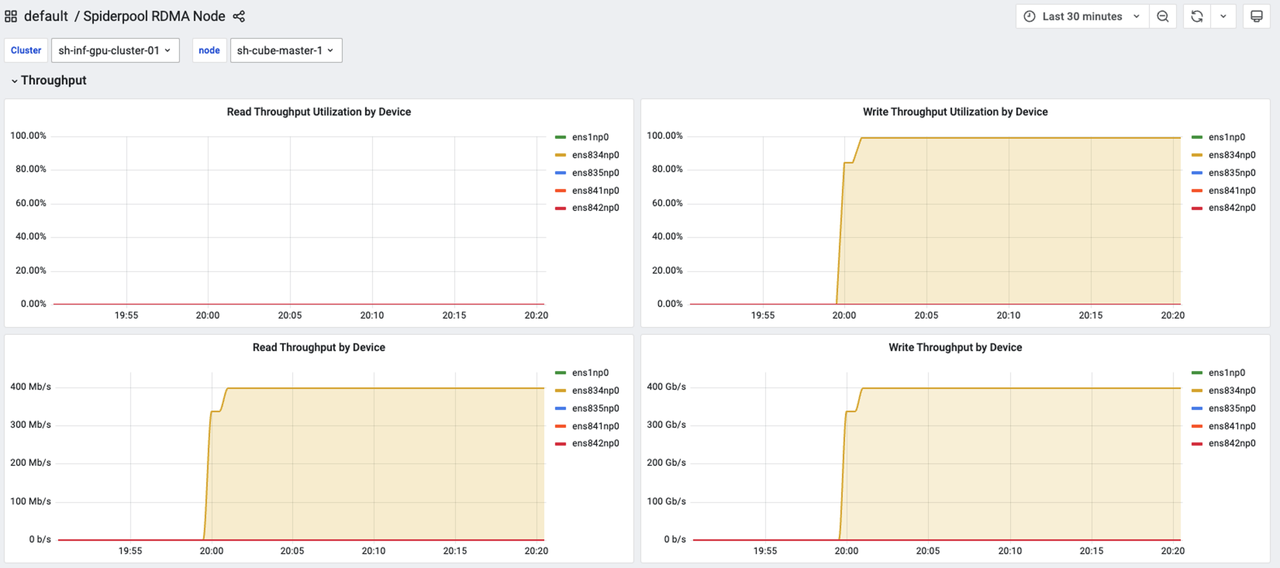
Throughput
| Panel Name | Panel Description |
|---|---|
| Read Throughput Utilization by Device | Read throughput percentage dashboard for different RDMA physical devices on the node (percentage is calculated based on the NIC port's transmission bandwidth / maximum transmission bandwidth). |
| Write Throughput Utilization by Device | Write throughput percentage dashboard for different RDMA physical devices on the node (percentage is calculated based on the NIC port's transmission bandwidth / maximum transmission bandwidth). |
| Read Throughput by Device | Read throughput dashboard for different RDMA physical devices on the node. |
| Write Throughput by Device | Write throughput dashboard for different RDMA physical devices on the node. |
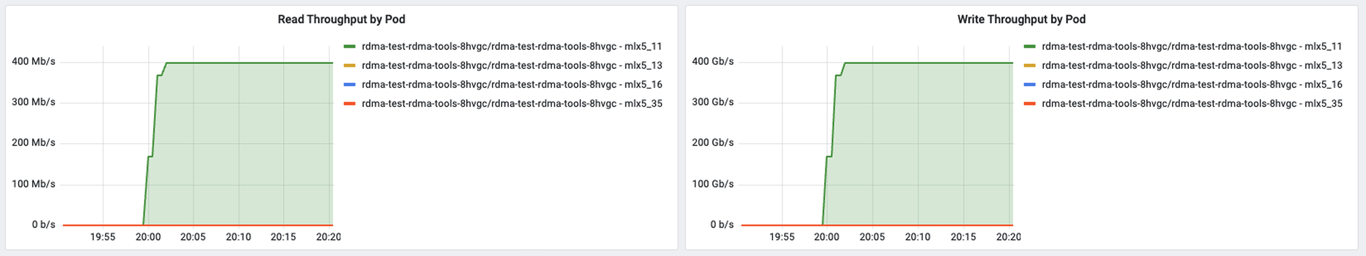
| Read Throughput by Pod | Statistics of Pod read bandwidth on the node. If abnormal node bandwidth usage is detected, this dashboard can be used to identify which Pod is consuming excessive bandwidth. |
| Write Throughput by Pod | Statistics of Pod write bandwidth on the node. If abnormal node bandwidth usage is detected, this dashboard can be used to identify which Pod is consuming excessive bandwidth. |
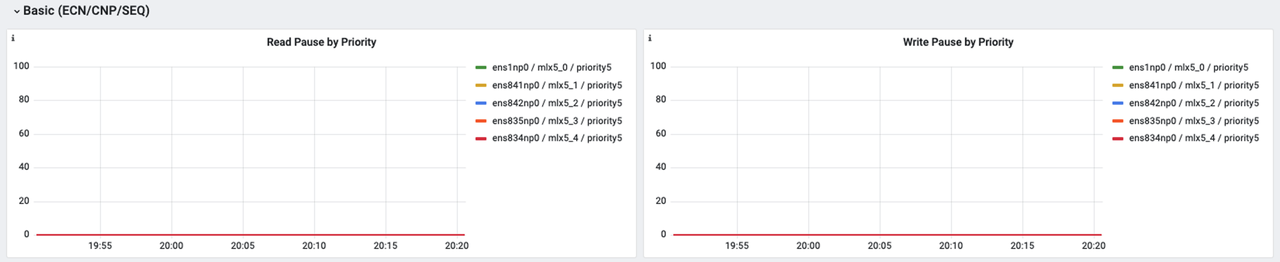
Basic (ECN/CNP/SEQ)
| Panel Name | Panel Description |
|---|---|
| Read Pause by Priority | Number of link-layer pause frames received on the physical port. If this counter continues to increase, it indicates network congestion and the network cannot effectively carry traffic from the adapter. Essentially equivalent to the upstream telling me, please pause sending data for a while. |
| Write Pause by Priority | How many pause requests the NIC has sent to other devices on the network. When the queue occupied by RDMA traffic approaches saturation, the NIC will send PFC Pause frames to upstream devices, requesting them to pause sending traffic with the same priority. |
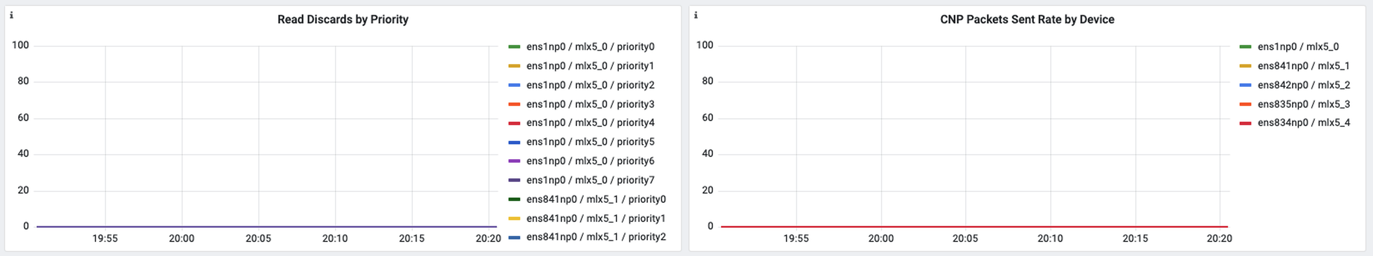
| Read Discards by Priority | Flow control was not triggered in time, causing the upstream to continue sending packets that the NIC cannot process in time. The NIC attempts to DMA data to host memory but fails, for example in scenarios where RDMA communication is already closed. |
| CNP Packets Sent Rate by Device | When the NP detects that the ECN bit of a received packet is set, it generates and sends a CNP (Congestion Notification Packet) to the sender, prompting the sender to slow down the data transmission rate. |
| ECN Marked RoCEv2 Packets Rate by Device | Statistics of RoCEv2 data packets received by the receiving NP that were marked as severely congested in the network. |
| CNP Packets Handled Rate by Device | Statistics of how many CNP congestion notification packets were processed by the reaction point HCA in the network, in order to limit and adjust the data transmission rate to avoid network overload. |
| Out of Sequence Packets Rate by Device | Number of out-of-order data packets received. |
| CNP Packets Ignored Rate by Device | Number of CNPs (congestion notification packets) received but ignored by the Reaction Point HCA. |
Detail
| Panel Name | Panel Description |
|---|---|
| RX Write Requests | Number of RDMA Write requests received by the receiver. |
| RX Read Requests | Number of RDMA Read requests received by the receiver. |
| RX Atomic Requests | Number of Atomic operation requests received by the receiver. |
| RX DCT Connect | Number of DCT (Dynamic Connection Transport) connection requests processed by the receiver (see Appendix Table 1 for advantages and disadvantages of transport modes RC, UD, DCT). |
| Out of buffer | Number of packet losses due to lack of WQE (Work Queue Element) in the associated QP (Queue Pair). |
| Duplicate Request | Number of received data packets. Duplicate requests refer to requests that have been executed previously. |
| RNR NAK Retry Error | Number of RNR NAK (Receiver Not Ready negative acknowledgment) packets received. At this point, the QP's retry limit has not been exceeded. |
| Packet Seq Error | Number of NAK (sequence error) packets received. At this point, the QP's retry limit has not been exceeded. (In RDMA/InfiniBand communication, each Queue Pair (QP) has a Reliable Connection (RC) protocol to ensure reliable data transmission. Each packet sent by the sender has a sequence number, and the receiver checks the sequence number to ensure packet order and integrity.) |
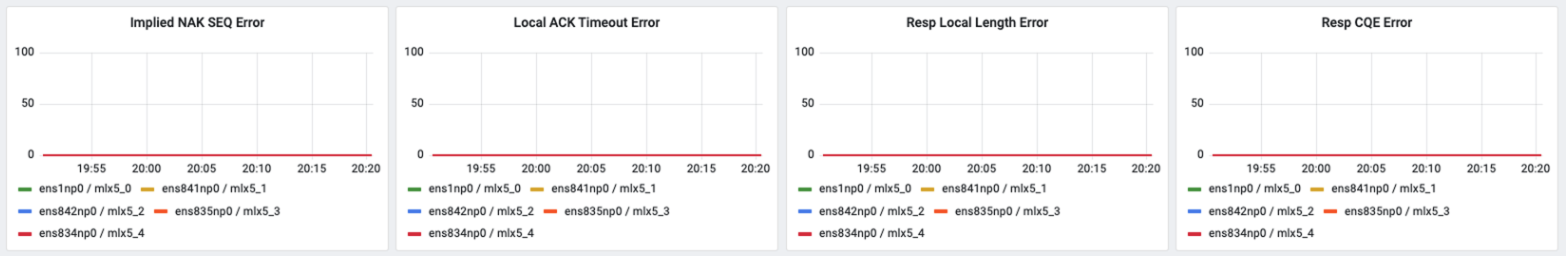
| Implied NAK SEQ Error | Number of times the requester sends an ACK whose acknowledged PSN (Packet Sequence Number) is greater than the PSN expected by the RDMA Read or response. |
| Local ACK Timeout Error | Number of times the ACK timer expired on the sender RC, XRC, or DCT QP. This is still a recoverable error because the QP's retry limit has not been exceeded. |
| Resp Local Length Error | Number of times the receiver detected a Local Length Error (LLE). |
| Resp CQE Error | Number of times the receiver detected a Completion Queue Element (CQE) with an error. |
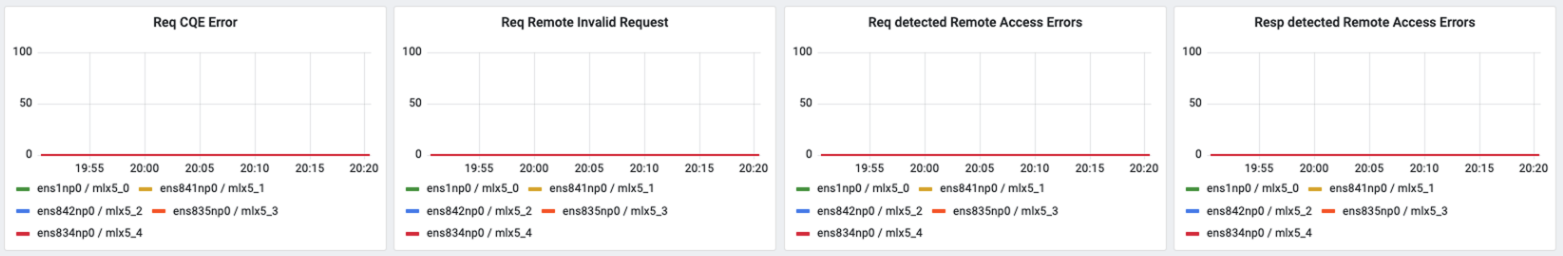
| Req CQE Error | Number of times the sender detected a Completion Queue Element (CQE) with an error. |
| Req Remote Invalid Request | Number of times the sender detected a Remote Invalid Request (RIR) error. |
| Req detected Remote Access Errors | Number of times the sender detected Remote Access errors. |
| Resp detected Remote Access Errors | Number of times the receiver detected Remote Access errors. |
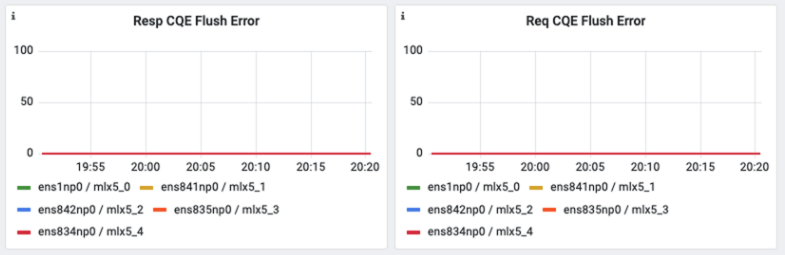
| Resp CQE Flush Error | Number of times the receiver detected a Completion Queue Element (CQE) completed with a flush error. |
| Req CQE Flush Error | Number of times the sender detected a Completion Queue Element (CQE) completed with a flush error. |
Appendix Table 1: Advantages and disadvantages of transport modes RC, UD, DCT.
| Transport Mode | Advantages | Disadvantages / Characteristics |
|---|---|---|
| RC | Complete semantic support for atomic operations; minimal point-to-point latency | Requires one QP per endpoint pair; poor scalability |
| UD | Single QP supports multicast/multiple endpoints; scalable | Unreliable - requires handling retransmission, ordering, serialization yourself - typically used for message layer protocols (such as some MPI implementations) |
| DCT | Provides reliability and RDMA primitives close to RC; allows multiple initiators to multiplex fewer initiating QPs (DCI); reduces server-side resource overhead | Compromise solution: neither fully point-to-point like RC nor completely connectionless like UD; requires DCT-supporting hardware/drivers |
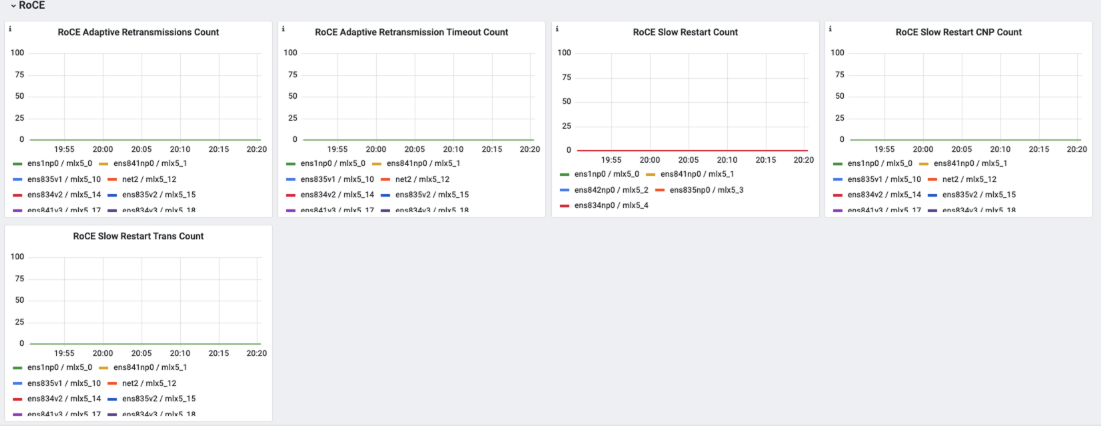
RoCE
| Panel Name | Panel Description |
|---|---|
| RoCE Adaptive Retransmissions Count | Number of adaptive retransmissions for RoCE traffic. In cases of network packet loss or congestion, RoCE adaptively adjusts retransmission strategies to improve reliability. |
| RoCE Adaptive Retransmission Timeout Count | Number of times RoCE traffic timed out due to adaptive retransmission. |
| RoCE Slow Restart Count | Number of times RoCE slow restart was used. After congestion or prolonged idle periods, RoCE gradually resumes the transmission rate to avoid sudden network overload. |
| RoCE Slow Restart CNP Count | CNPs may be triggered during slow restart to notify the sender to reduce the transmission rate. |
Spiderpool RDMA Cluster - Cluster Dashboard
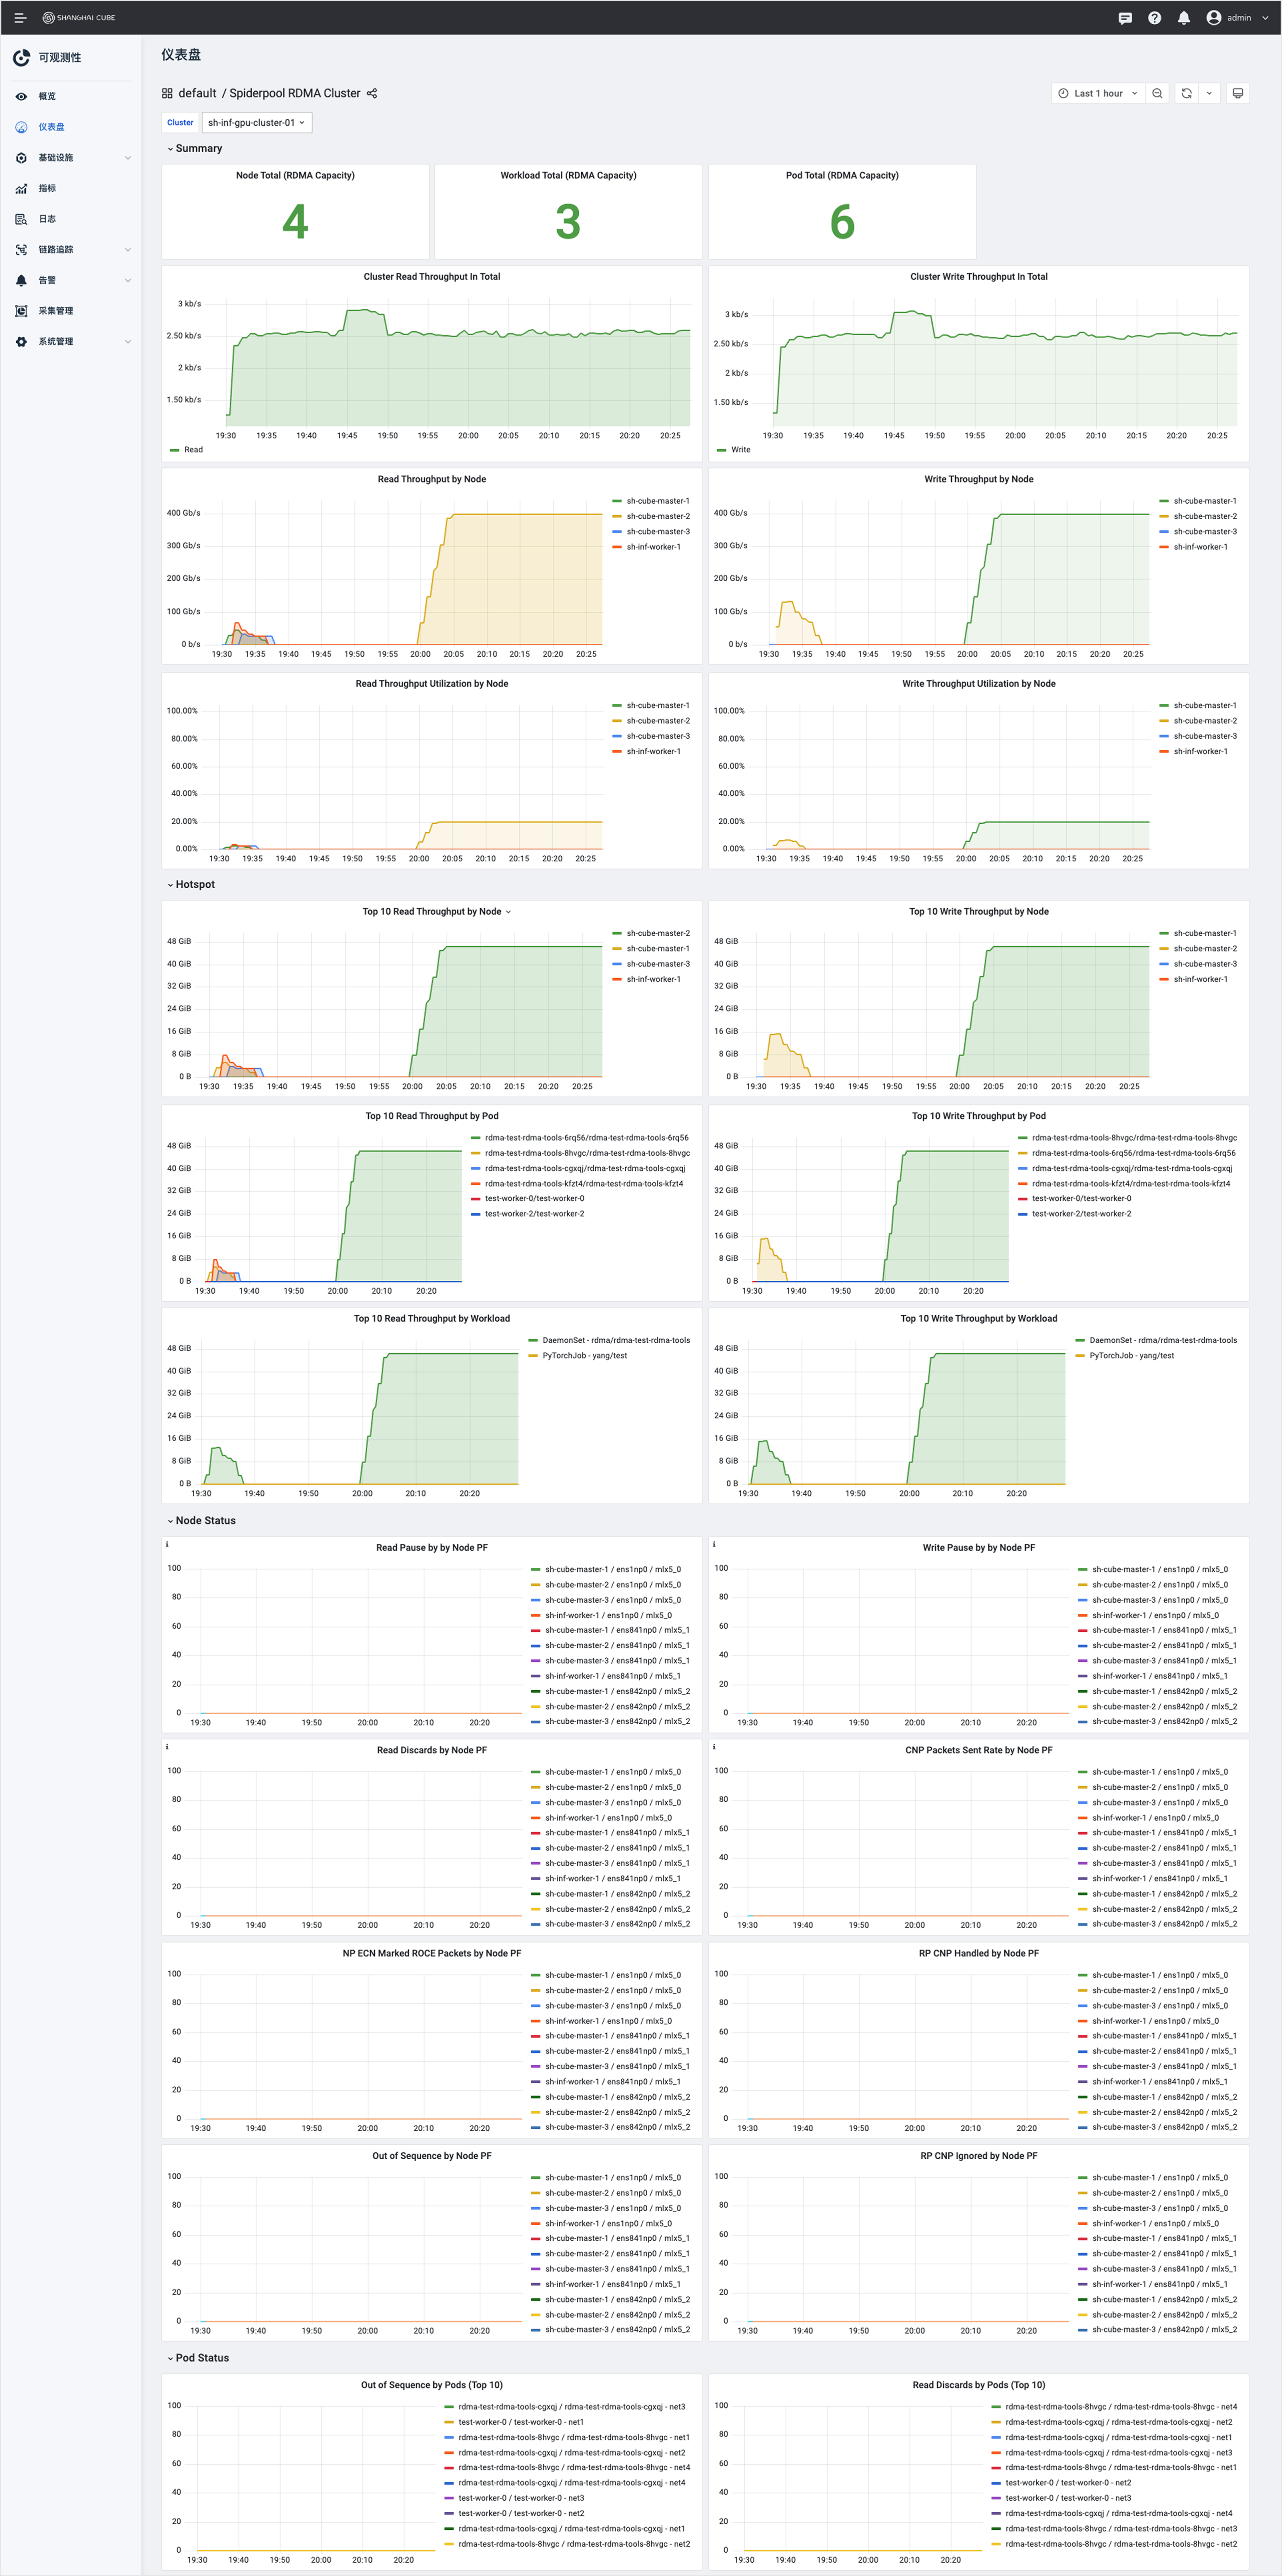
This dashboard is divided into 3 sections:
-
Summary
Panel Name Panel Description Node Total (RDMA Capacity) Number of nodes with RDMA capability. Workload Total (RDMA Capacity) Statistics of RDMA workload count. Pod Total (RDMA Capacity) RDMA Pod count dashboard. -
Hotspot
- The Hotspot section is mainly used to identify cluster hotspot workloads, which can help determine whether applications are fully load-balanced or whether workloads are reasonable.
- Top 10 Read Throughput by Node
- Top 10 Write Throughput by Node
- Top 10 Read Throughput by Pod
- Top 10 Write Throughput by Pod
- Top 10 Read Throughput by Workload
- Top 10 Write Throughput by Workload
- The Hotspot section is mainly used to identify cluster hotspot workloads, which can help determine whether applications are fully load-balanced or whether workloads are reasonable.
- Node Status
- This section has the same statistics as the individual Node panel, and the specific meanings can be referenced above. The difference is that this provides a cluster-wide view of all nodes, making it easy to directly identify which node has issues.
- Read Pause by Node PF
- Write Pause by Node PF
- Read Discards by Node PF
- CNP Packets Sent Rate by Node PF
- NP ECN Marked ROCE Packets by Node PF
- RP CNP Handled by Node PF
- Out of Sequence by Node PF
- RP CNP Ignored by Node PF
- This section has the same statistics as the individual Node panel, and the specific meanings can be referenced above. The difference is that this provides a cluster-wide view of all nodes, making it easy to directly identify which node has issues.
- Pod Status
- Pod Status provides statistics on common Pod out-of-order packets/packet loss, making it easy to quickly view issues at the cluster level.
- Out of Sequence by Pods (Top 10)
- Read Discards by Pods (Top 10)
- Pod Status provides statistics on common Pod out-of-order packets/packet loss, making it easy to quickly view issues at the cluster level.
Spiderpool RDMA AI Workload - Workload Dashboard
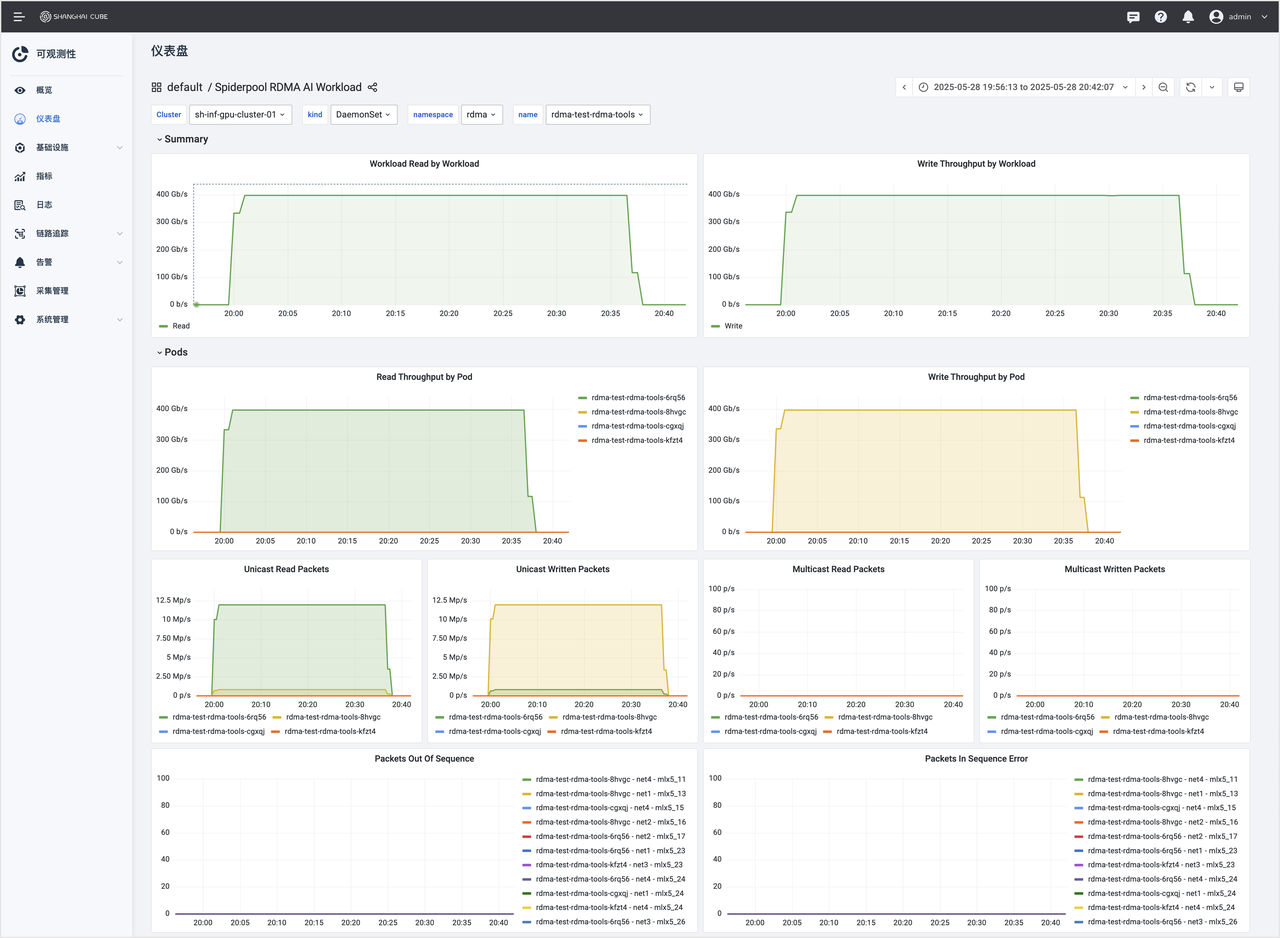
RDMA Workload can be used to monitor Pods of a specific workload group. For example, PytorchJob often spans multiple nodes, and sometimes a single Pod anomaly can cause the entire PytorchJob training to fail.
The Workload perspective makes it easy to locate problematic Pods. The specific metric meanings can refer to the Node panel descriptions above; the only difference here is that the object is Pods under a Workload.
Spiderpool RDMA SRIOV Pod - RDMA Pod Dashboard
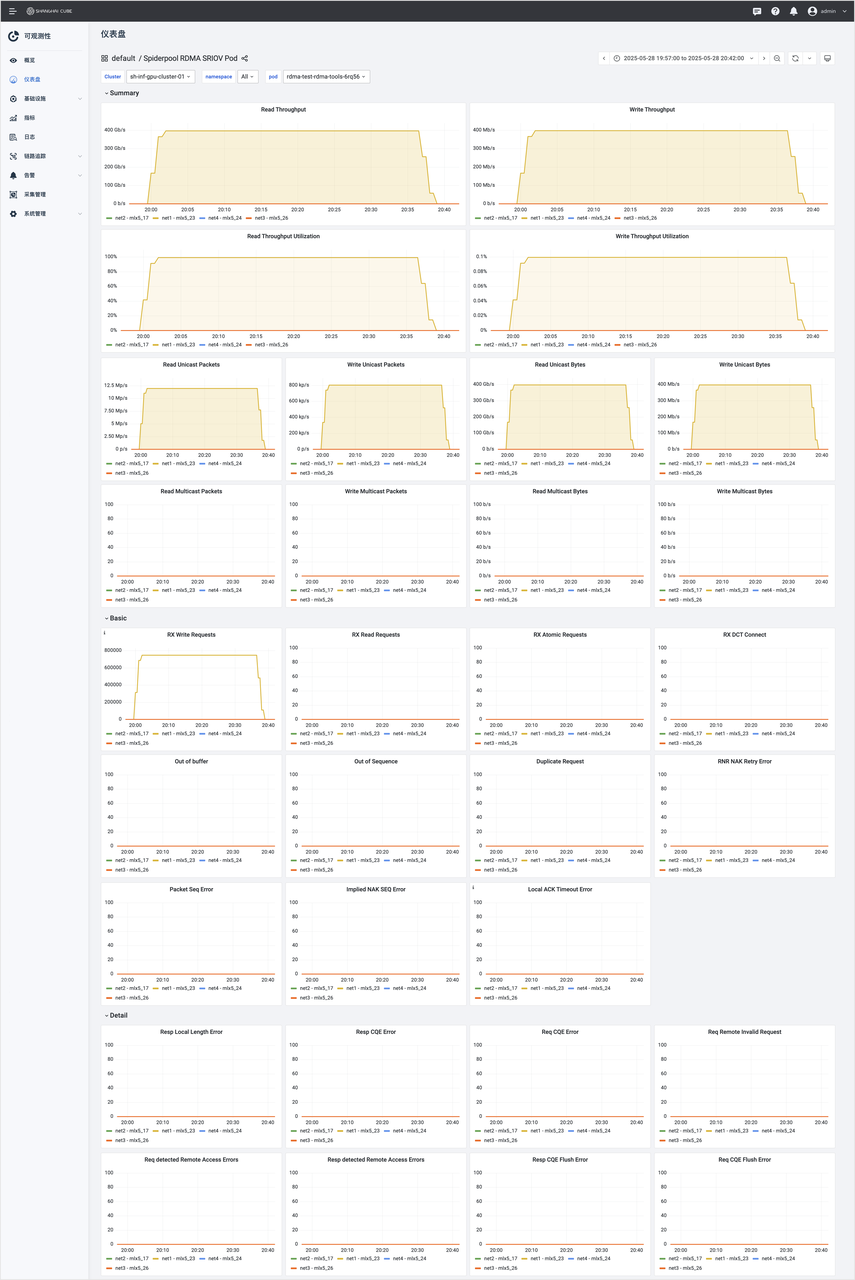
RDMA Pod is for monitoring a specific Pod. When troubleshooting at the cluster or node level identifies a Pod with issues, the Pod panel can be used for interference-free investigation. The specific metric meanings can refer to the Node panel descriptions above; the only difference here is that the object is a single Pod.