Unifabric Overview
Unifabric is an RDMA network observability and automated O&M platform for high-performance computing (HPC) and AI cloud platforms. It is designed for RDMA network environments (such as RoCE) and helps users achieve network topology visualization, performance monitoring and analysis, and intelligent diagnosis from the underlying links to the upper-layer compute nodes.
Unifabric is dedicated to solving the pain points of RDMA networks being "invisible, undiagnosable, and hard to tune", helping users:
- Gain a global view of the network topology structure and real-time status
- Quickly locate performance bottlenecks such as latency, packet loss, and congestion
- Build a stable, efficient, and scalable RDMA network infrastructure
Quick Deployment
Unifabric is based on the Kubernetes native architecture and provides a standard Helm Chart, supporting rapid deployment in any compatible Kubernetes cluster.
The platform consists of two parts:
| Component | Responsibility |
|---|---|
| Controller | Responsible for topology construction and switch data collection |
| Agent | Deployed on each host to collect node RDMA status and link information |
Core Capabilities at a Glance
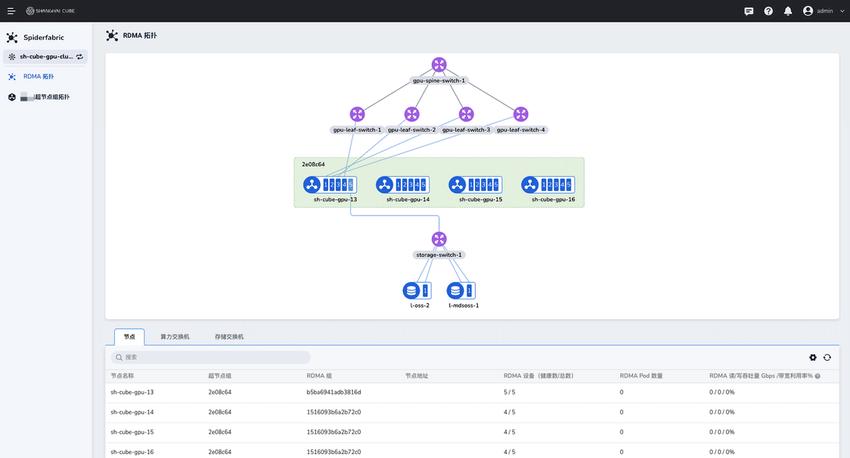
1. RDMA Network Full-View Topology
- Automatically build a hierarchical Spine-Leaf-node topology
- Dynamically display the connection relationships among switches, compute nodes, and storage devices
- Support real-time changes of link health status, with automatic detection of link interruption
2. Super Node Group Visualization
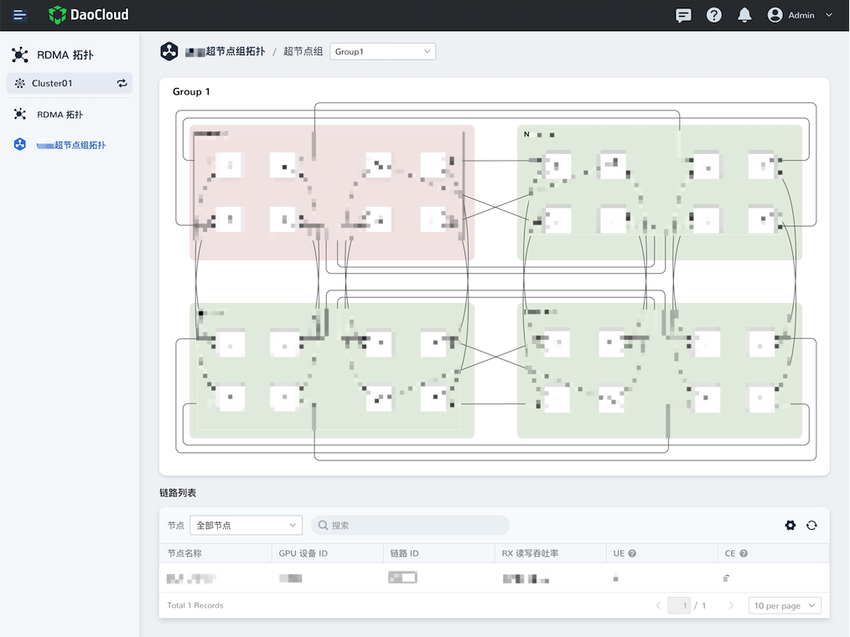
- Support displaying the internal structure of a GPU compute cluster grouped by logical super nodes
- Display the GPU RDMA network topology among nodes within a group
- Support clicking a link to view performance metrics, assisting problem location
3. Network Monitoring and Link Analysis
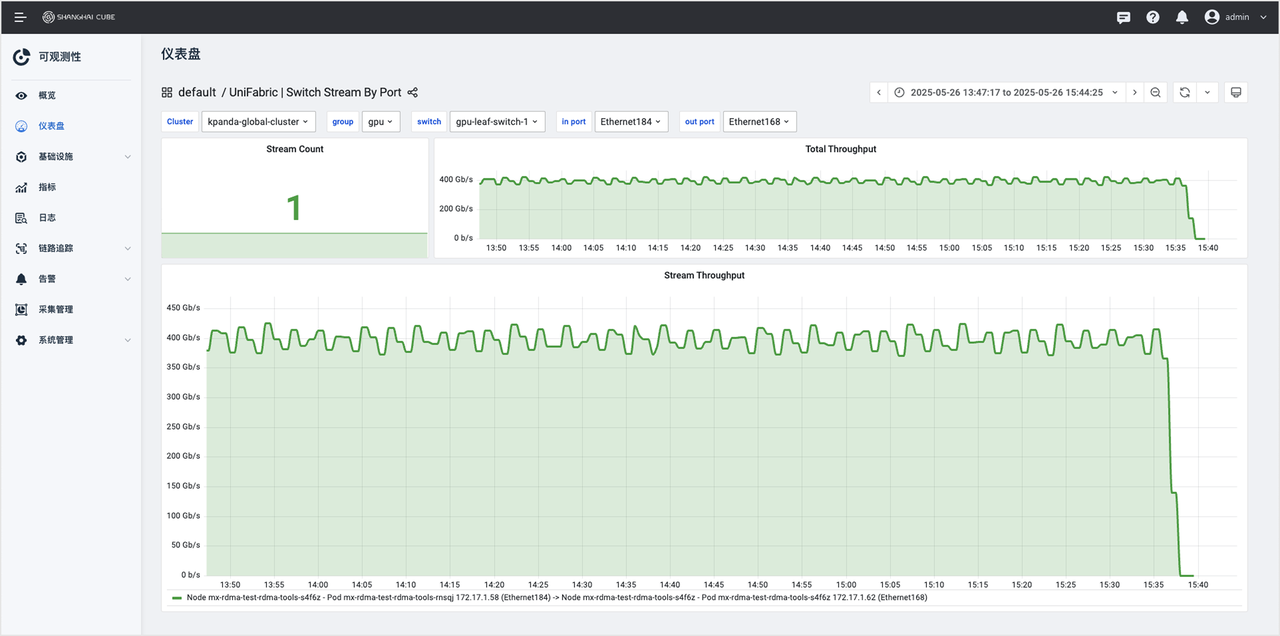
- Collect switch port status, bandwidth, utilization, error codes, and other metrics in real time
- Support viewing link RX/TX bandwidth, congestion (CE), error (UE), and other data
- Provide a link performance analysis view, supporting link historical trend analysis
4. Automatic Grouping and Intelligent Diagnosis
- Based on LLDP + RDMA topology, automatically group nodes with consistent network structures
- Detect link anomalies, NIC status anomalies, link inconsistency between nodes, and other problems
- Support node health assessment and labeling, helping the scheduling system optimize resource usage
5. Network-Aware Intelligent Scheduling
- Based on the automatically identified network topology and super node group information, intelligently schedule workloads to the optimal node combination.
- When a network fault occurs in the cluster (such as a link interruption, NIC failure, or switch failure), automatically adjust the scheduling policy to avoid placing new tasks in the faulty area.
- Expose scheduling capabilities to upper-layer applications and scheduling frameworks through standardized API interfaces.
Feature Highlights
| Module | Capability Description |
|---|---|
| Topology Visualization | Hierarchically display the Spine / Leaf / compute node / storage device topology |
| Automatic Link Status Detection | Update network connection status in real time; broken links are hidden automatically |
| Node Monitoring | Display GPU node status, the number of RDMA NICs, and bandwidth usage |
| Switch Monitoring | Display the port status, bandwidth, and utilization of compute switches and storage switches |
| Link Performance Analysis | View the real-time bandwidth, CE/UE errors, and interconnected GPU information of any link |
| Super Node Group View | Display the interconnection structure of nodes within a group; click to view link details |
| Multi-Cluster Support | Support unified access of multiple Kubernetes clusters and cross-cluster network views |
| Grafana Integration | Built-in monitoring dashboards, supporting custom charts and metric queries |
| Automatic Grouping | Automatically divide nodes into schedulable groups based on the network topology |
| Fault Diagnosis Assistance | Detect link anomalies, switch port anomalies, and node connection inconsistencies |
| Intelligent Scheduling | Recommend the optimal node combination based on the automatically identified topology and super node information |
| Standard Interfaces | Provide API interfaces for seamless integration with K8s plugins, enabling rapid exposure of capabilities to upper-layer architectures |
Scenarios
Unifabric applies to the following typical scenarios:
- AI model training platforms: Monitor the communication links between GPU nodes to improve training efficiency
- High-performance computing (HPC) clusters: Detect network bottlenecks in time to ensure stable operation of computing tasks
- RDMA storage access scenarios: Monitor the health of the RDMA channel between GPUs and storage devices
- Multi-tenant AI cloud platforms: Support synchronized access of multi-cluster resources and unified display of network status
Why Choose Unifabric?
- Built for RDMA networks, supporting the RoCE protocol and LLDP topology discovery
- Full-lifecycle observability: From nodes, links, and switches to automatic topology identification
- Kubernetes native integration: Support CRD management and automated O&M
- Rich monitoring metrics: Built-in Prometheus & Grafana support
- Intelligent grouping and diagnosis engine: Help optimize network performance and resource scheduling
Next Steps
Want to learn how to deploy it? See Install Unifabric
Want to learn how to collect and monitor link metrics? See RDMA Latency Monitoring Usage Guide