Install Unifabric
Part 1: Installing the Unifabric Core Components
Install Unifabric
Prerequisites
- Kubernetes cluster: Make sure you have a running Kubernetes cluster
- Helm 3.x: Used to install Unifabric
- RDMA network environment: An RDMA network environment is required and the RoCE protocol is supported
- Switch LLDP support: Make sure the LLDP protocol is enabled on the network switches
Recommended Versions
| Component | Recommended Version |
|---|---|
| Kubernetes | v1.22+ |
| Helm | v0.0.3+ |
Installation Steps
If you need to use the RDMA neighbor detection feature, make sure the LLDP protocol is enabled on the network switches
-
Configure node labels
The Unifabric Controller runs only on nodes with
unifabric.io/deploy=true. Add this label to the nodes that run the Unifabric Controller:The Unifabric Agent should run only on nodes with RDMA network capability. For nodes or virtual machine nodes that do not support RDMA, set the label
unifabric.io/deploy=falseto prevent the Unifabric Agent from running on them. -
Add the Helm repository
-
Configure the installation parameters
helm upgrade --install unifabric unifabric/unifabric \ --namespace unifabric \ --create-namespace \ --set features.rdmaNeighbor.storageRdmaNicFilter="interface=ens2f0*"storageRdmaNicFilterspecifies which RDMA NICs on the node are used as RDMA storage NICs. Other RDMA NICs are used as GPU compute network NICs. If this field is not configured, all RDMA NICs are used as GPU compute network NICs. -
Verify the installation
-
Check the Pod status:
Expected output:
NAME                         READY   STATUS    RESTARTS   AGE
unifabric-746d4f8d75-qbknh   1/1     Running   0          2m
unifabric-agent-4rpbw        2/2     Running   0          2m
unifabric-agent-fgpkc        2/2     Running   0          2m
Note: The
unifabric-agentPod contains two containers:lldpdandunifabric-agent. -
Check the FabricNode CRD status:
-
View the neighbor information of a specific node:
Confirm that the
status.computeNicsandstatus.storageNicsfields contain the correct LLDP neighbor information. -
Verify the ScaleoutGroup automatic grouping feature and check the ScaleoutLeafGroup CRD:
-
Check whether the node has the scaleoutleafgroup label:
-
Check whether metrics are collected properly:
-
Troubleshooting
Refer to Troubleshooting
Upgrade
Upgrade Unifabric to a new version:
Uninstall
Uninstall Unifabric:
For a complete cleanup, also delete the CRDs and the namespace:
Monitoring and Visualization
If the Grafana dashboard is installed, you can view the Unifabric monitoring data and network topology visualization through DCE Insight or by accessing Grafana directly.
Part 2: Switch Node Access
Feature Description
Switch node access (Switch Port Detail) displays the detailed information of switch ports, including port status and neighbor device information. This feature connects to the switch through the gNMI protocol, obtains the port status and neighbor device information, and stores them in Kubernetes custom resources.
Supported Switch Models
Currently, Cloudnix switches are supported. Support for certain NVIDIA switch models will be provided in the future.
Field Description
apiVersion: unifabric.io/v1beta1
kind: SwitchEndpoint
metadata:
  name: gpu-leaf-switch-1
spec:
  connection:
    gnmi:
      port: 8080
    host: 10.193.77.201
  group: gpu
  manufacturer: cloudnix
status:
  conditions:
    - lastTransitionTime: "2025-08-19T00:05:57Z"
      message: Successfully connected to SwitchEndpoint
      reason: Connected
      status: "True"
      type: Connected
  ports:
    details:
      - name: Ethernet0 # Port name
        neighbor: # Describes the neighbor device connected to this port, making it easier to locate the physical topology.
          portID: Ethernet0 # Port identifier of the neighbor device. If the peer is a host, this is the MAC address; if it is a switch, this is the peer port name.
          portName: Ethernet0 # Neighbor device port name, which is the NIC name or port name.
          sysName: SPINE01 # System name of the neighbor device.
        status: up
      - name: Ethernet8
        neighbor:
          portID: Ethernet8
          portName: Ethernet8
          sysName: SPINE01
        status: up
Troubleshooting
If you encounter problems when using the Switch Port Detail feature, follow these steps to troubleshoot:
-
Check whether the SwitchEndpoint resource exists in Kubernetes and its status is Connected:
-
Check whether the Unifabric Pod in Kubernetes is running properly:
-
Sign in to the switch and run
show lldp summaryto check whether the port status and neighbors are normal. - Sign in to the switch and run
show loggingto check whether the switch log contains abnormal information.
Part 3: Storage Node Access
Feature Overview
Unifabric supports connecting external bare metal storage nodes into a Kubernetes cluster for unified management and monitoring. By deploying the unifabric agent on the storage node, the agent collects the RDMA network status and LLDP neighbor information of the storage node and reports the data to the unifabric control plane in the Kubernetes cluster. You can also view the monitoring data of storage nodes on the Grafana dashboard of the cluster.
Supported Storage Server Models
All general-purpose Linux servers are supported.
Basic Requirements
- Docker must be installed on the storage node (docker compose support is required)
- The storage node must be able to access the API Server of the Kubernetes cluster
- The storage node must be a bare metal server with RDMA NICs
- The unifabric components must be deployed and running in the Kubernetes cluster to be connected
Create the kubeconfig File
On the control node of the Kubernetes cluster to which the storage node is to be connected, run the following command to generate the kubeconfig file:
# Specify the namespace where unifabric is installed
UNIFABRIC_NAMESPACE="unifabric"

cat > cluster1-kubeconfig.yaml <<EOF
apiVersion: v1
kind: Config
clusters:
- cluster:
    certificate-authority-data: $(kubectl config view --raw -o jsonpath="{.clusters[0].cluster.certificate-authority-data}")
    server: $(kubectl config view --raw -o jsonpath="{.clusters[0].cluster.server}")
  name: $(kubectl config view --raw -o jsonpath="{.clusters[0].name}")
contexts:
- context:
    cluster: $(kubectl config view --raw -o jsonpath="{.clusters[0].name}")
    user: unifabric-sa-token
    namespace: ${UNIFABRIC_NAMESPACE}
  name: unifabric-sa-token@$(kubectl config view --raw -o jsonpath="{.clusters[0].name}")
current-context: unifabric-sa-token@$(kubectl config view --raw -o jsonpath="{.clusters[0].name}")
users:
- name: unifabric-sa-token
  user:
    token: $(kubectl get secret unifabric-sa-token -n ${UNIFABRIC_NAMESPACE} -o jsonpath='{.data.token}' | base64 -d)
EOF
This kubeconfig file is generated based on the ServiceAccount unifabric-sa-token in the namespace where unifabric is installed, and contains only the minimum permissions required to access unifabric.
Verify locally that the content of the kubeconfig file is correct:
kubectl --kubeconfig=cluster1-kubeconfig.yaml version
kubectl --kubeconfig=cluster1-kubeconfig.yaml get pods -A
Copy the kubeconfig file to /etc/unifabric/cluster1-kubeconfig.yaml on the storage node server for use in the following steps.
Deploy lldp and the unifabric Agent (Using Docker Compose)
This section describes how to deploy the lldp and unifabric agent services on a storage node using Docker Compose. Perform the following steps on each logical bare metal storage node.
1. Run the lldp service
Deploy the unifabric-lldp service on each storage host. Even if a host is connected to multiple Kubernetes clusters, only one instance needs to be deployed. First, create the /etc/unifabric/lldp.yaml file:
sudo mkdir -p /etc/unifabric
cat <<'EOF' | sudo tee /etc/unifabric/lldp.yaml > /dev/null
services:
  unifabric-lldp:
    image: ${UNIFABRIC_AGENT_IMAGE}
    container_name: unifabric-lldp
    command: ["/usr/bin/unifabric/entrypoint.sh"]
    network_mode: host
    restart: always
    privileged: true
    environment:
      # Node IP information (optional)
      NODE_IPADDRESS: ${NODE_IPADDRESS}
      # LLDP transmit interval, in seconds (optional)
      LLDPD_TX_INTERVAL: 30
      # Interfaces on which LLDP is enabled, as a comma-separated list
      # LLDPD_INTERFACE_PATTERN: ""
    volumes:
      - /var/run:/var/run
      - /etc/hostname:/etc/hostname:ro
    healthcheck:
      test: CMD-SHELL lldpcli -v || exit 1
      interval: 5s
      timeout: 3s
      retries: 5
EOF
Start the lldp service with the following command. Set the UNIFABRIC_AGENT_IMAGE environment variable to specify the agent image version, using the version that matches the Kubernetes cluster. Optionally, set the NODE_IPADDRESS environment variable to specify the node IP address, which is used for LLDP broadcast.
UNIFABRIC_AGENT_IMAGE="release.daocloud.io/unifabric/unifabric-agent:latest" \
  sudo -E docker compose -f /etc/unifabric/lldp.yaml up -d
2. Start the unifabric-agent service
Make sure the kubeconfig created in the previous section exists at /etc/unifabric/cluster1-kubeconfig.yaml.
Create the unifabric agent configuration file /etc/unifabric/cluster1-agent-config.yaml:
export METRICS_PORT=5025
export STORAGE_RDMA_NIC_FILTER="interface=*"

cat <<EOF | sudo tee /etc/unifabric/cluster1-agent-config.yaml > /dev/null
inStorageNode: true
metrics:
  port: ${METRICS_PORT}
rdmaNeighbor:
  # Matches the storage RDMA NICs. Wildcards are supported
  storageRdmaNicFilter: "${STORAGE_RDMA_NIC_FILTER}"
EOF
inStorageNodeindicates that the agent runs on an external storage node. It must be set totrue.- The
metrics.portparameter specifies the port used to expose metrics on the storage node. The default value is5025and can be modified as needed. If multiple clusters are connected, use different ports to avoid conflicts. - The
storageRdmaNicFilterparameter is used to match the RDMA NIC interface names of the storage node. Wildcards are supported. For example,ens*matches all interface names starting withens. Adjust it according to the NIC naming rules of the actual storage node.
Create the Docker Compose file /etc/unifabric/cluster1-agent-compose.yaml:
cat <<'EOF' | sudo tee /etc/unifabric/cluster1-agent-compose.yaml > /dev/null
services:
  unifabric-agent:
    image: ${UNIFABRIC_AGENT_IMAGE}
    container_name: unifabric-agent
    network_mode: host
    restart: always
    privileged: true
    volumes:
      - /etc/unifabric/cluster1-kubeconfig.yaml:/root/.kube/config
      - /etc/unifabric/cluster1-agent-config.yaml:/etc/config/config.yaml
      - /var/run:/var/run
      - /etc/hostname:/etc/hostname:ro
      - /proc:/host/proc:ro
    command:
      - /usr/bin/unifabric/agent
      - -config
      - /etc/config/config.yaml
EOF


UNIFABRIC_AGENT_IMAGE="release.daocloud.io/unifabric/unifabric-agent:latest" \
  sudo -E docker compose -f /etc/unifabric/cluster1-agent-compose.yaml up -d
- Note: Replace
UNIFABRIC_AGENT_TAGwith the image version that matches the Kubernetes cluster. Different clusters may require different versions of the agent image. - If you need to connect to multiple clusters, you can copy this file and modify the service name and configuration file path, for example
cluster1-agent-compose.yaml, and use the corresponding kubeconfig and configuration file.
Configure Storage Node Metrics Scraping in the Cluster
On the Kubernetes cluster control node, generate the storage node metrics scraping configuration file unifabric-metrics-external.yaml:
# Set the storage node IP list, separated by commas
export STORAGE_NODE_IPS="1.1.1.1,2.2.2.2"
# Set the storage node RDMA agent metrics port
export AGENT_PORT_METRICS="5025"
# Set the storage node RDMA latency metrics port
export RDMA_LATENCY_PORT_METRICS="5027"

# Generate the configuration file content
cat > unifabric-metrics-external.yaml << EOF
apiVersion: v1
kind: Service
metadata:
  name: unifabric-metrics-external
  namespace: unifabric
  labels:
    app: unifabric-metrics-external
spec:
  clusterIP: None
  ports:
    - name: metrics-agent
      port: ${AGENT_PORT_METRICS}
      targetPort: ${AGENT_PORT_METRICS}
    - name: metrics-rdma-latency-cluster1
      port: ${RDMA_LATENCY_PORT_METRICS}
      targetPort: ${RDMA_LATENCY_PORT_METRICS}
---
apiVersion: v1
kind: Endpoints
metadata:
  name: unifabric-metrics-external
  namespace: unifabric
subsets:
  - addresses:
$(IFS=',' read -ra IPS <<< "$STORAGE_NODE_IPS"; for ip in "${IPS[@]}"; do echo "      - ip: $ip"; done)
    ports:
      - name: metrics-agent
        port: ${AGENT_PORT_METRICS}
      - name: metrics-rdma-latency
        port: ${RDMA_LATENCY_PORT_METRICS}
---
apiVersion: monitoring.coreos.com/v1
kind: ServiceMonitor
metadata:
  name: unifabric-metrics-external
  namespace: unifabric
  labels:
    operator.insight.io/managed-by: insight
    release: kube-prometheus-stack
spec:
  selector:
    matchLabels:
      app: unifabric-metrics-external
  namespaceSelector:
    matchNames:
      - unifabric
  endpoints:
    - port: metrics-agent
      interval: 30s
      path: /metrics
    - port: metrics-rdma-latency
      interval: 30s
      path: /metrics
EOF
Deploy the configuration file:
Verify the Storage Node Access Status
Run the following command to see the newly connected node:
Then view the fabricnode YAML information of the storage node and confirm that the RDMA NIC and LLDP neighbor information have been collected:
Example output:
apiVersion: unifabric.io/v1beta1
kind: FabricNode
metadata:
  name: l-oss-2
status:
  rdmaHealthy: true
  scaleUp:
    scaleUpHealthy: false
  storageNics:
    - ipv4: 172.16.1.41/24
      ipv6: ""
      lldpNeighbor:
        description:
          "SONiC Software Version: SONiC.CuOS_4.0-0.R_X86_64_ztp - HwSku:
          ds730-32d - Distribution: 10.13 - Kernel: 4.19.0-12-2-amd64"
        hostname: StorageSW
        mac: 70:06:92:6e:32:64
        mgmtIP: 10.193.77.211
        port: Ethernet200
      name: ens2np0
      rdma: true
      state: up
    - ipv4: ""
      ipv6: ""
      lldpNeighbor:
        description:
          "SONiC Software Version: SONiC.CuOS_4.0-0.R_X86_64_ztp - HwSku:
          ds730-32d - Distribution: 10.13 - Kernel: 4.19.0-12-2-amd64"
        hostname: StorageSW
        mac: 70:06:92:6e:32:64
        mgmtIP: 10.193.77.211
        port: Ethernet192
      name: ens1np0
      rdma: true
      state: up
Check the LLDP neighbor information on the switch to confirm that the storage node has broadcast through LLDP:
View the metrics data of the storage node:
In the Grafana of kube-prometheus-stack, view the dashboards related to storage nodes and make sure that the metric data of the storage nodes can be viewed.
Connect to Multiple Clusters
If the storage node needs to be connected to multiple Kubernetes clusters, you can create a separate kubeconfig and agent configuration file for each cluster, and then create the corresponding Docker Compose file to start multiple unifabric agent instances. For example, you can create cluster2-kubeconfig.yaml, cluster2-agent-config.yaml, and cluster2-agent-compose.yaml, and use different metrics ports to avoid conflicts.
Uninstall the Storage Node Agent
Run the following commands to uninstall the unifabric service on the storage node:
# Uninstall the unifabric agent service
# If multiple clusters are connected, uninstall the corresponding agent services separately,
# for example cluster2-agent-compose.yaml
docker compose down -f /etc/unifabric/cluster1-agent-compose.yaml

# If you need to uninstall the lldp service, run:
docker compose down -f /etc/unifabric/lldp.yaml

# If you need to delete all configuration files, run:
sudo rm -rf /etc/unifabric
Troubleshooting
If the storage node is not connected properly, check the agent log to troubleshoot:
docker compose logs -f /etc/unifabric/cluster1-agent-compose.yaml
docker compose logs -f /etc/unifabric/lldp.yaml
If the log indicates that the Kubernetes cluster cannot be connected, check whether the content of /etc/unifabric/cluster1-kubeconfig.yaml is correct. You can use the kubectl command to test the connection:
If there is no metrics data, check the firewall settings of the storage node and make sure port 5025 is open. Then test metrics scraping with curl:
Part 4: RDMA Topology Discovery Configuration
Feature Overview
The RDMA network neighbor discovery feature of Unifabric is a comprehensive network topology discovery system designed for RDMA networks. This feature performs underlying neighbor discovery based on the LLDP protocol and provides multiple upper-layer network management capabilities on top of it. The core capabilities include:
- LLDP neighbor discovery: Underlying network topology discovery based on the LLDP protocol, supporting all types of switch devices
- Dedicated to RDMA networks: Currently specifically designed for RDMA network environments based on the RoCE protocol
- NIC classification management: Distinguishes the GPU compute network (computeNics) from the storage network (storageNics)
- rdmaNeighbor grouping: An automatic grouping feature specifically for the GPU compute network, used for node topology management in scale-out scenarios
- Kubernetes native: Deeply integrated into the Kubernetes environment, managing the network status through the FabricNode CRD
Among them, rdmaNeighbor is an upper-layer feature based on LLDP neighbor discovery. It is dedicated to topology grouping of the GPU compute network and is unrelated to the storage network. By analyzing the GPU compute network connection relationships between nodes, it automatically groups nodes with the same network topology, providing intelligent node management capabilities for scale-out computing scenarios.
- LLDP Neighbor Discovery
- Switch Neighbor Reporting
- ScaleoutLeafGroup Automatic Grouping
- Storage Host Neighbor Reporting
GPU Network Classification Concepts
- GPU compute network (computeNics): A high-speed RDMA network used for inter-GPU communication, model training, and inference computing
- GPU storage network (storageNics): A dedicated RDMA network used for data transfer between GPUs and the storage system
Architecture Design
The neighbor discovery feature adopts a layered architecture:
__________________________________________________________________________________
|                                                                                  |
|                            RDMA Network Neighbor Discovery                        |
|__________________________________________________________________________________|
|  LLDP neighbor discovery  |  Switch neighbor reporting  |  External storage neighbor reporting  |
|  (Host Neighbor)          |  (Switch Neighbor)          |  (Storage Neighbor)                   |
|                           |                             |                                       |
|  • GPU compute network    |  • Switch topology          |  • Storage cluster discovery          |
|  • GPU storage network    |  • gnmi integration         |  • Cross-cluster connection           |
|  • LLDP protocol          |  • LLDP protocol            |  • Storage path optimization          |
|___________________________|_____________________________|_______________________________________|
LLDP Neighbor Discovery
LLDP neighbor discovery feature: Unifabric runs the lldpd daemon to automatically discover neighbor devices in the GPU compute network and the GPU storage network through the LLDP protocol, and synchronizes them to the Status field of the FabricNode CRD for topology display in the RDMA network.
Enable the RDMA Network Neighbor Discovery Feature
Note: This feature requires that the LLDP protocol is enabled on the switch; otherwise neighbor devices cannot be discovered.
The best-practice configuration is already set by default. Refer to Install Unifabric above. The following is a detailed description of the Helm values parameters related to this feature:
features:
  rdmaNeighbor:
    # Enable the extended neighbor discovery feature
    enabled: true

    # Interval at which FabricNode synchronizes LLDP neighbors
    timeToWaitSyncLLDPToFabricNode: 1m

    # GPU compute network NIC filter rule
    # Used to filter which RDMA NICs on the node belong to computeNics
    # Supports interface name wildcards (interface=) or subnets (cidr=)
    # Example: gpuRdmaNicFilter: "cidr=172.16.0.0/16"
    gpuRdmaNicFilter: "interface=ens16*"

    # GPU storage network NIC filter rule
    # Used to filter which RDMA NICs on the node belong to storageNics
    storageRdmaNicFilter: "interface=ens17*"
    # Example: storageRdmaNicFilter: "cidr=172.17.0.0/16"

    # LLDP daemon configuration
    lldpd:
      # LLDP packet transmit interval (seconds)
      txInterval: 30

      # Management IP configuration mode. The default value is empty,
      # which uses the Kubelet NodeIP as the management IP
      # Supported: IP address list | interface name | automatic selection (leave empty)
      managementIPPattern: ""

      # LLDP enabled interfaces. If empty, it applies to all RDMA NICs
      # Supported: specific interface | pattern match | all interfaces (leave empty)
      interfaces: "ens*"
Description of gpuRdmaNicFilter and storageRdmaNicFilter
These configurations determine which RDMA physical NICs of the host are counted into computeNics and storageNics in FabricNode.status:
- NIC classification priority:
storageRdmaNicFilteris checked first; NICs that do not match are counted intocomputeNicsinFabricNode.status - If neither
gpuRdmaNicFilternorstorageRdmaNicFilteris configured, all physical NICs of the host are counted intocomputeNicsinFabricNode.status - If both
gpuRdmaNicFilterandstorageRdmaNicFilterare configured, filtering is performed according to the wildcard values, and the NICs are counted intocomputeNicsandstorageNicsinFabricNode.statusrespectively
Recommended configuration: Set storageRdmaNicFilter first. RDMA NICs that do not match are automatically counted into computeNics in FabricNode.status.
Description of agent.config.rdmaNeighbor.lldpd.interfaces
-
Specific interfaces:
-
Pattern match:
-
Exclusion pattern:
-
All interfaces (default):
-
Deploy or update Unifabric with Helm
Verify Whether the RDMA Network Neighbor Discovery Feature Works Properly
-
Check whether the unifabric components (especially the lldpd container) are running properly. The lldpd log runs as an independent container in the unifabric-agent pod:
-
Check whether the
lldpNeighborfield of all NICs incomputeNicsandstorageNicsof the FabricNode CRD contains neighbor information:
Note: Because LLDP neighbor collection takes some time, by default unifabric-agent waits one minute before synchronizing the LLDP neighbor information to the Status field of the FabricNode CRD. To adjust the waiting time, modify the Helm parameter
agent.config.rdmaNeighbor.timeToWaitSyncLLDPToFabricNode. The default value is 1 minute.
apiVersion: unifabric.io/v1beta1
kind: FabricNode
metadata:
  creationTimestamp: "2025-06-19T07:02:08Z"
  generation: 1
  name: sh-cube-master-3
  resourceVersion: "48723802"
  uid: aa85f55f-d87f-4fbe-8dbc-e3c9cc089943
spec: {}
status:
  gpuNics:
  - ipv4: 172.17.3.143/24
    ipv6: ""
    lldpNeighbor:
      description: 'SONiC Software Version: SONiC.CuOS_4.0-0.R_X86_64_ztp - HwSku:
        ds730-32d - Distribution: 10.13 - Kernel: 4.19.0-12-2-amd64'
      hostname: LEAF03
      mac: 70:06:92:6e:32:1c
      mgmtIP: 10.193.77.203
      port: Ethernet208
    name: ens841np0
    rdma: true
    state: up
  - ipv4: 172.17.4.143/24
    ipv6: ""
    lldpNeighbor:
      description: 'SONiC Software Version: SONiC.CuOS_4.0-0.R_X86_64_ztp - HwSku:
        ds730-32d - Distribution: 10.13 - Kernel: 4.19.0-12-2-amd64'
      hostname: LEAF04
      mac: 70:06:92:6e:34:5c
      mgmtIP: 10.193.77.204
      port: Ethernet208
    name: ens842np0
    rdma: true
    state: up
  - ipv4: 172.17.2.143/24
    ipv6: ""
    lldpNeighbor:
      description: 'SONiC Software Version: SONiC.CuOS_4.0-0.R_X86_64_ztp - HwSku:
        ds730-32d - Distribution: 10.13 - Kernel: 4.19.0-12-2-amd64'
      hostname: LEAF02
      mac: 70:06:92:6e:34:80
      mgmtIP: 10.193.77.202
      port: Ethernet200
    name: ens835np0
    rdma: true
    state: up
  - ipv4: 172.17.1.143/24
    ipv6: ""
    lldpNeighbor:
      description: 'SONiC Software Version: SONiC.CuOS_4.0-0.R_X86_64_ztp - HwSku:
        ds730-32d - Distribution: 10.13 - Kernel: 4.19.0-12-2-amd64'
      hostname: LEAF01
      mac: 70:06:92:6e:33:18
      mgmtIP: 10.193.77.201
      port: Ethernet208
    name: ens834np0
    rdma: true
    state: up
  rdmaHealthy: true
  totalNics: 5
  storageNics:
  - ipv4: 172.16.1.143/24
    ipv6: ""
    lldpNeighbor:
      description: 'SONiC Software Version: SONiC.CuOS_4.0-0.R_X86_64_ztp - HwSku:
        ds730-32d - Distribution: 10.13 - Kernel: 4.19.0-12-2-amd64'
      hostname: StorageSW
      mac: 70:06:92:6e:32:64
      mgmtIP: 10.193.77.211
      port: Ethernet144
    name: ens1np0
    rdma: true
    state: up
You need to check:
- Whether
gpuNicsincludes every GPU compute NIC of the host, whether its IP address and status meet expectations, and whetherlldpNeighboraccurately contains the detailed information of the neighbor device. - Whether
storageNicsincludes every storage NIC of the host, whether its IP address and status meet expectations, and whetherlldpNeighboralso accurately contains the detailed information of the neighbor device. rdmaHealthyis true if all RDMA NICs are Ready (including NIC status and LLDP neighbor discovery); otherwise it is false.totalNicsindicates the total number of all RDMA NICs of the host, includinggpuNicsandstorageNics.
ScaleoutLeafGroup Automatic Grouping Feature
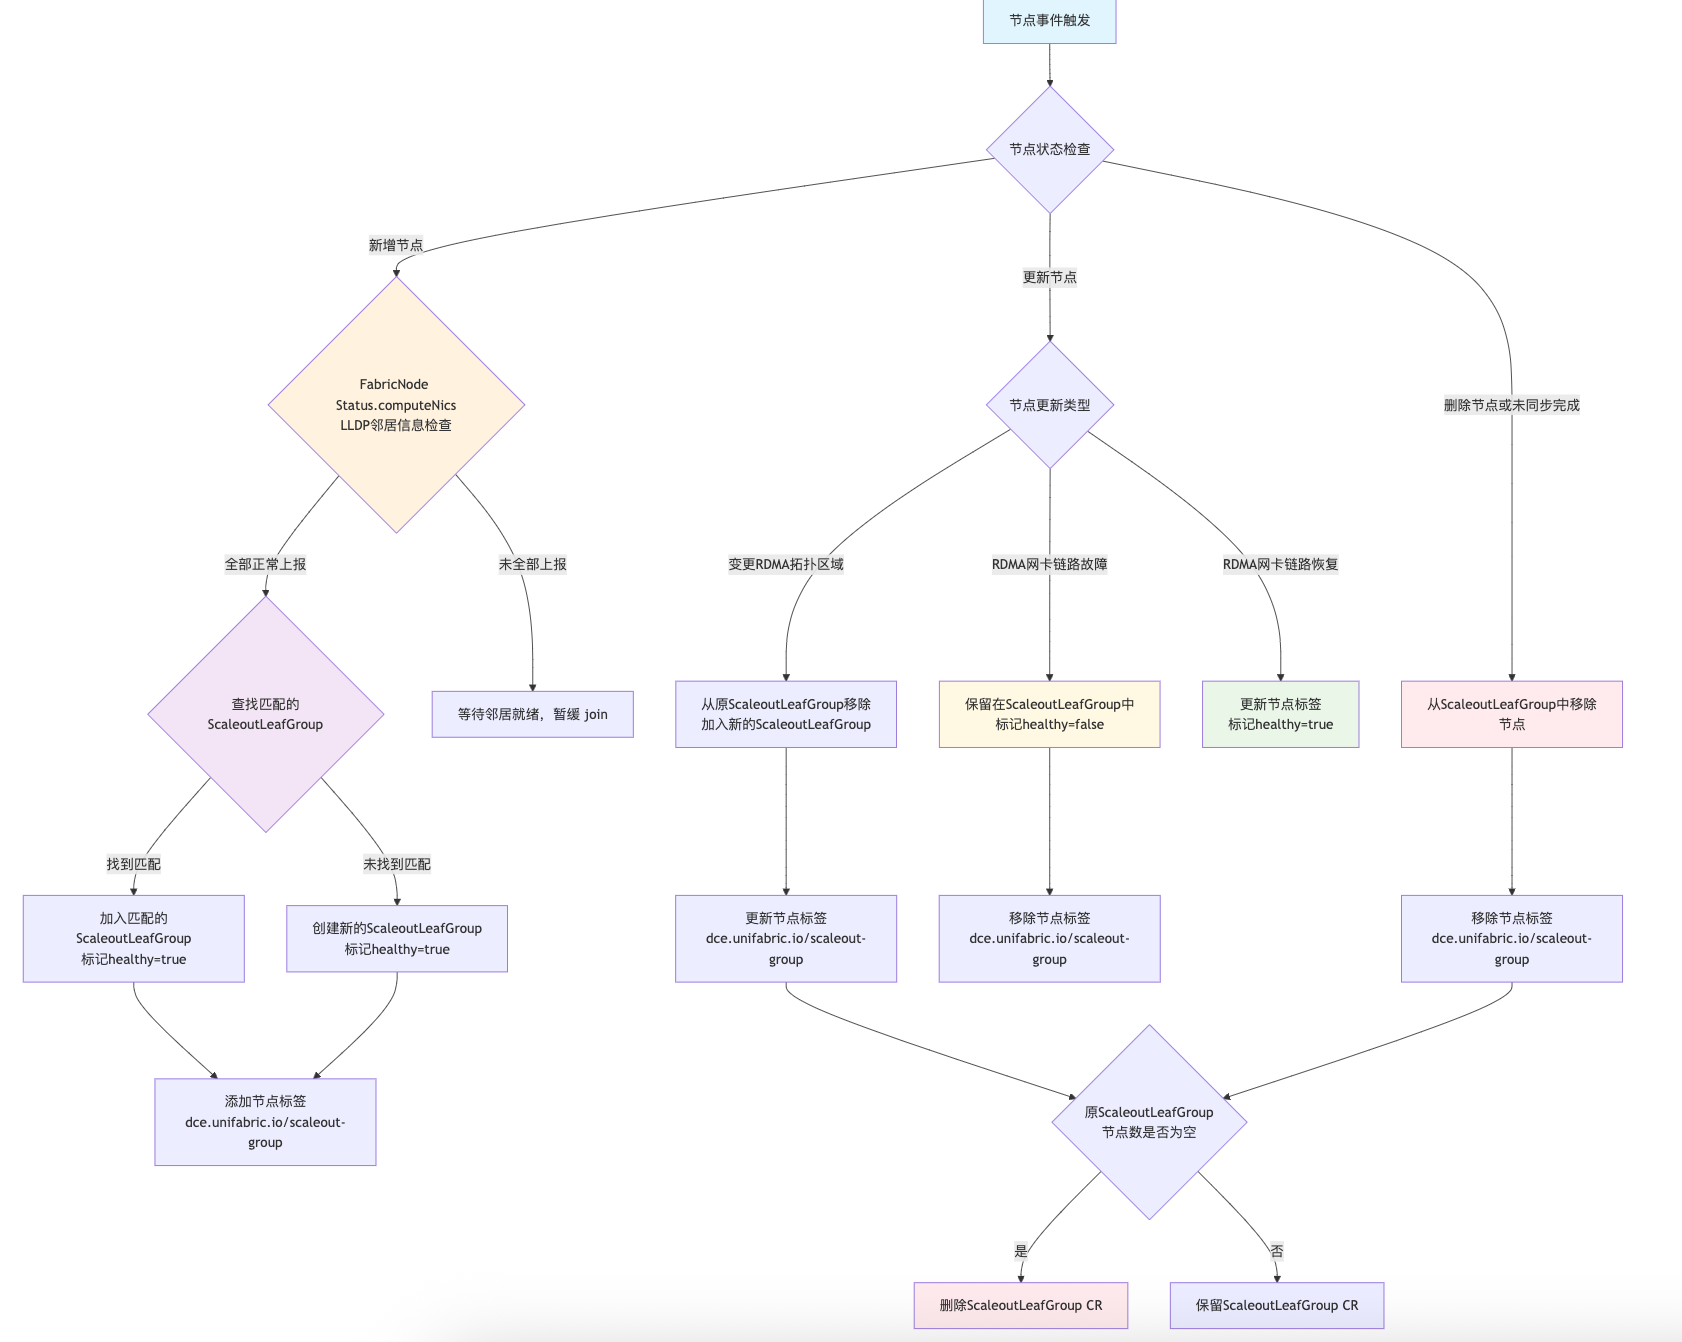
ScaleoutLeafGroup automatically groups nodes with the same GPU compute network topology based on the LLDP neighbor discovery information above, synchronizes the grouping information to the Status field of the ScaleoutLeafGroup CRD, and adds a set of identical labels to the nodes that belong to the same ScaleoutLeafGroup (default label key: dce.unifabric.io/scaleout-group, which can be customized through the Helm parameter features.rdmaNeighbor.nodeTopoZoneLabelKey; the value is the group name). This feature provides intelligent node grouping and network topology management capabilities for scale-out scenarios.
How It Works
The ScaleoutLeafGroup automatic grouping feature depends on the LLDP neighbor discovery information in the Status field of the FabricNode CRD. Therefore, you must ensure that the LLDP neighbor discovery in the Status.computeNics field of the FabricNode CRD is reported properly and the information is correct. By default, unifabric-agent waits one minute before synchronizing the LLDP neighbor information to the Status field of the FabricNode CRD. To adjust the waiting time, modify the Helm parameter features.rdmaNeighbor.timeToWaitSyncLLDPToFabricNode. The default value is 1 minute.
Configuration Example
This configuration is enabled by default in Install Unifabric. If you accidentally disabled it or encounter any problem, you can reconfigure it as follows:
Enable the ScaleoutLeafGroup automatic grouping feature in the Controller component:
features:
  rdmaNeighbor:
    # Enable the RDMA neighbor discovery feature
    enabled: true
    # Enable the ScaleoutLeafGroup automatic grouping feature
    enableScaleOutLeafGroup: true
    # ScaleoutLeafGroup automatic grouping label key
    nodeTopoZoneLabelKey: dce.unifabric.io/scaleoutleaf-group
Note:
features.rdmaNeighbor.enabledmust be enabled forfeatures.rdmaNeighbor.enableScaleOutLeafGroupto take effect.
Perform the installation:
Verify the Installation
-
Check whether the unifabric components are running properly:
-
Check whether the ScaleoutLeafGroup CRD is normal. One ScaleoutLeafGroup object represents a group of nodes with the same GPU network topology.
~# kubectl get scaleoutleafgroups.unifabric.io
NAME              healthyNodes   totalNodes   healthy   AGE
409bf491f7136a8a  4              4            true      6h1m
Description of the fields in the information above:
- NAME: The name of the ScaleoutLeafGroup, obtained by hashing the names of all switches in the group
- healthyNodes: The number of healthy nodes in the group
- totalNodes: The total number of nodes in the group
- healthy: Whether the group is healthy. If any node in the group is unhealthy, the group is unhealthy
- AGE: The creation time of the group
The following is an example of the ScaleoutLeafGroup CRD:
apiVersion: unifabric.io/v1beta1
kind: ScaleoutLeafGroup
metadata:
  creationTimestamp: "2025-09-18T03:37:59Z"
  generation: 1
  name: 409bf491f7136a8a
  resourceVersion: "85472900"
  uid: e8d34e3a-d73f-4587-b39a-9f80a72631c0
spec: {}
status:
  healthy: true # Whether the group is healthy. If any node in the group is unhealthy, the group is unhealthy
  nodes: # The list of nodes in the group. Each node has a healthy field indicating whether its RDMA link is normal
  - healthy: true
    name: sh-cube-master-1
  - healthy: true
    name: sh-cube-master-2
  - healthy: true
    name: sh-cube-master-3
  - healthy: true
    name: sh-inf-worker-1
  healthyNodes: # The number of healthy nodes in the group
  totalNodes:  # The total number of nodes in the group
  switches: # The list of switches to which all nodes in the group are connected
  - LEAF01
  - LEAF02
  - LEAF03
  - LEAF04
~# kubectl get nodes -l dce.unifabric.io/scaleoutleaf-group=409bf491f7136a8a
NAME               STATUS   ROLES                      AGE    VERSION
sh-cube-master-1   Ready    control-plane,fluent,gpu    130d   v1.30.5
sh-cube-master-2   Ready    control-plane,gpu          130d   v1.30.5
sh-cube-master-3   Ready    control-plane,gpu          130d   v1.30.5
sh-inf-worker-1    Ready    gpu                        130d   v1.30.5
If a node is removed from the group, or the RDMA link is abnormal (healthy is false), unifabric removes the dce.unifabric.io/scaleoutleaf-group label from that node.
Storage Host Neighbor Reporting
Note: This feature is planned for a future release.
The storage host neighbor reporting feature will implement topology discovery and status monitoring of storage host devices through RDMA link status monitoring, providing key infrastructure-layer information for building a complete network topology view.
Switch Neighbor Reporting
Note: This feature is planned for a future release.
The switch neighbor reporting feature will implement topology discovery and status monitoring of RDMA switch devices through the gNMI protocol and the switch management interface, providing key infrastructure-layer information for building a complete network topology view.
Troubleshooting
Refer to Troubleshooting