Security Protection
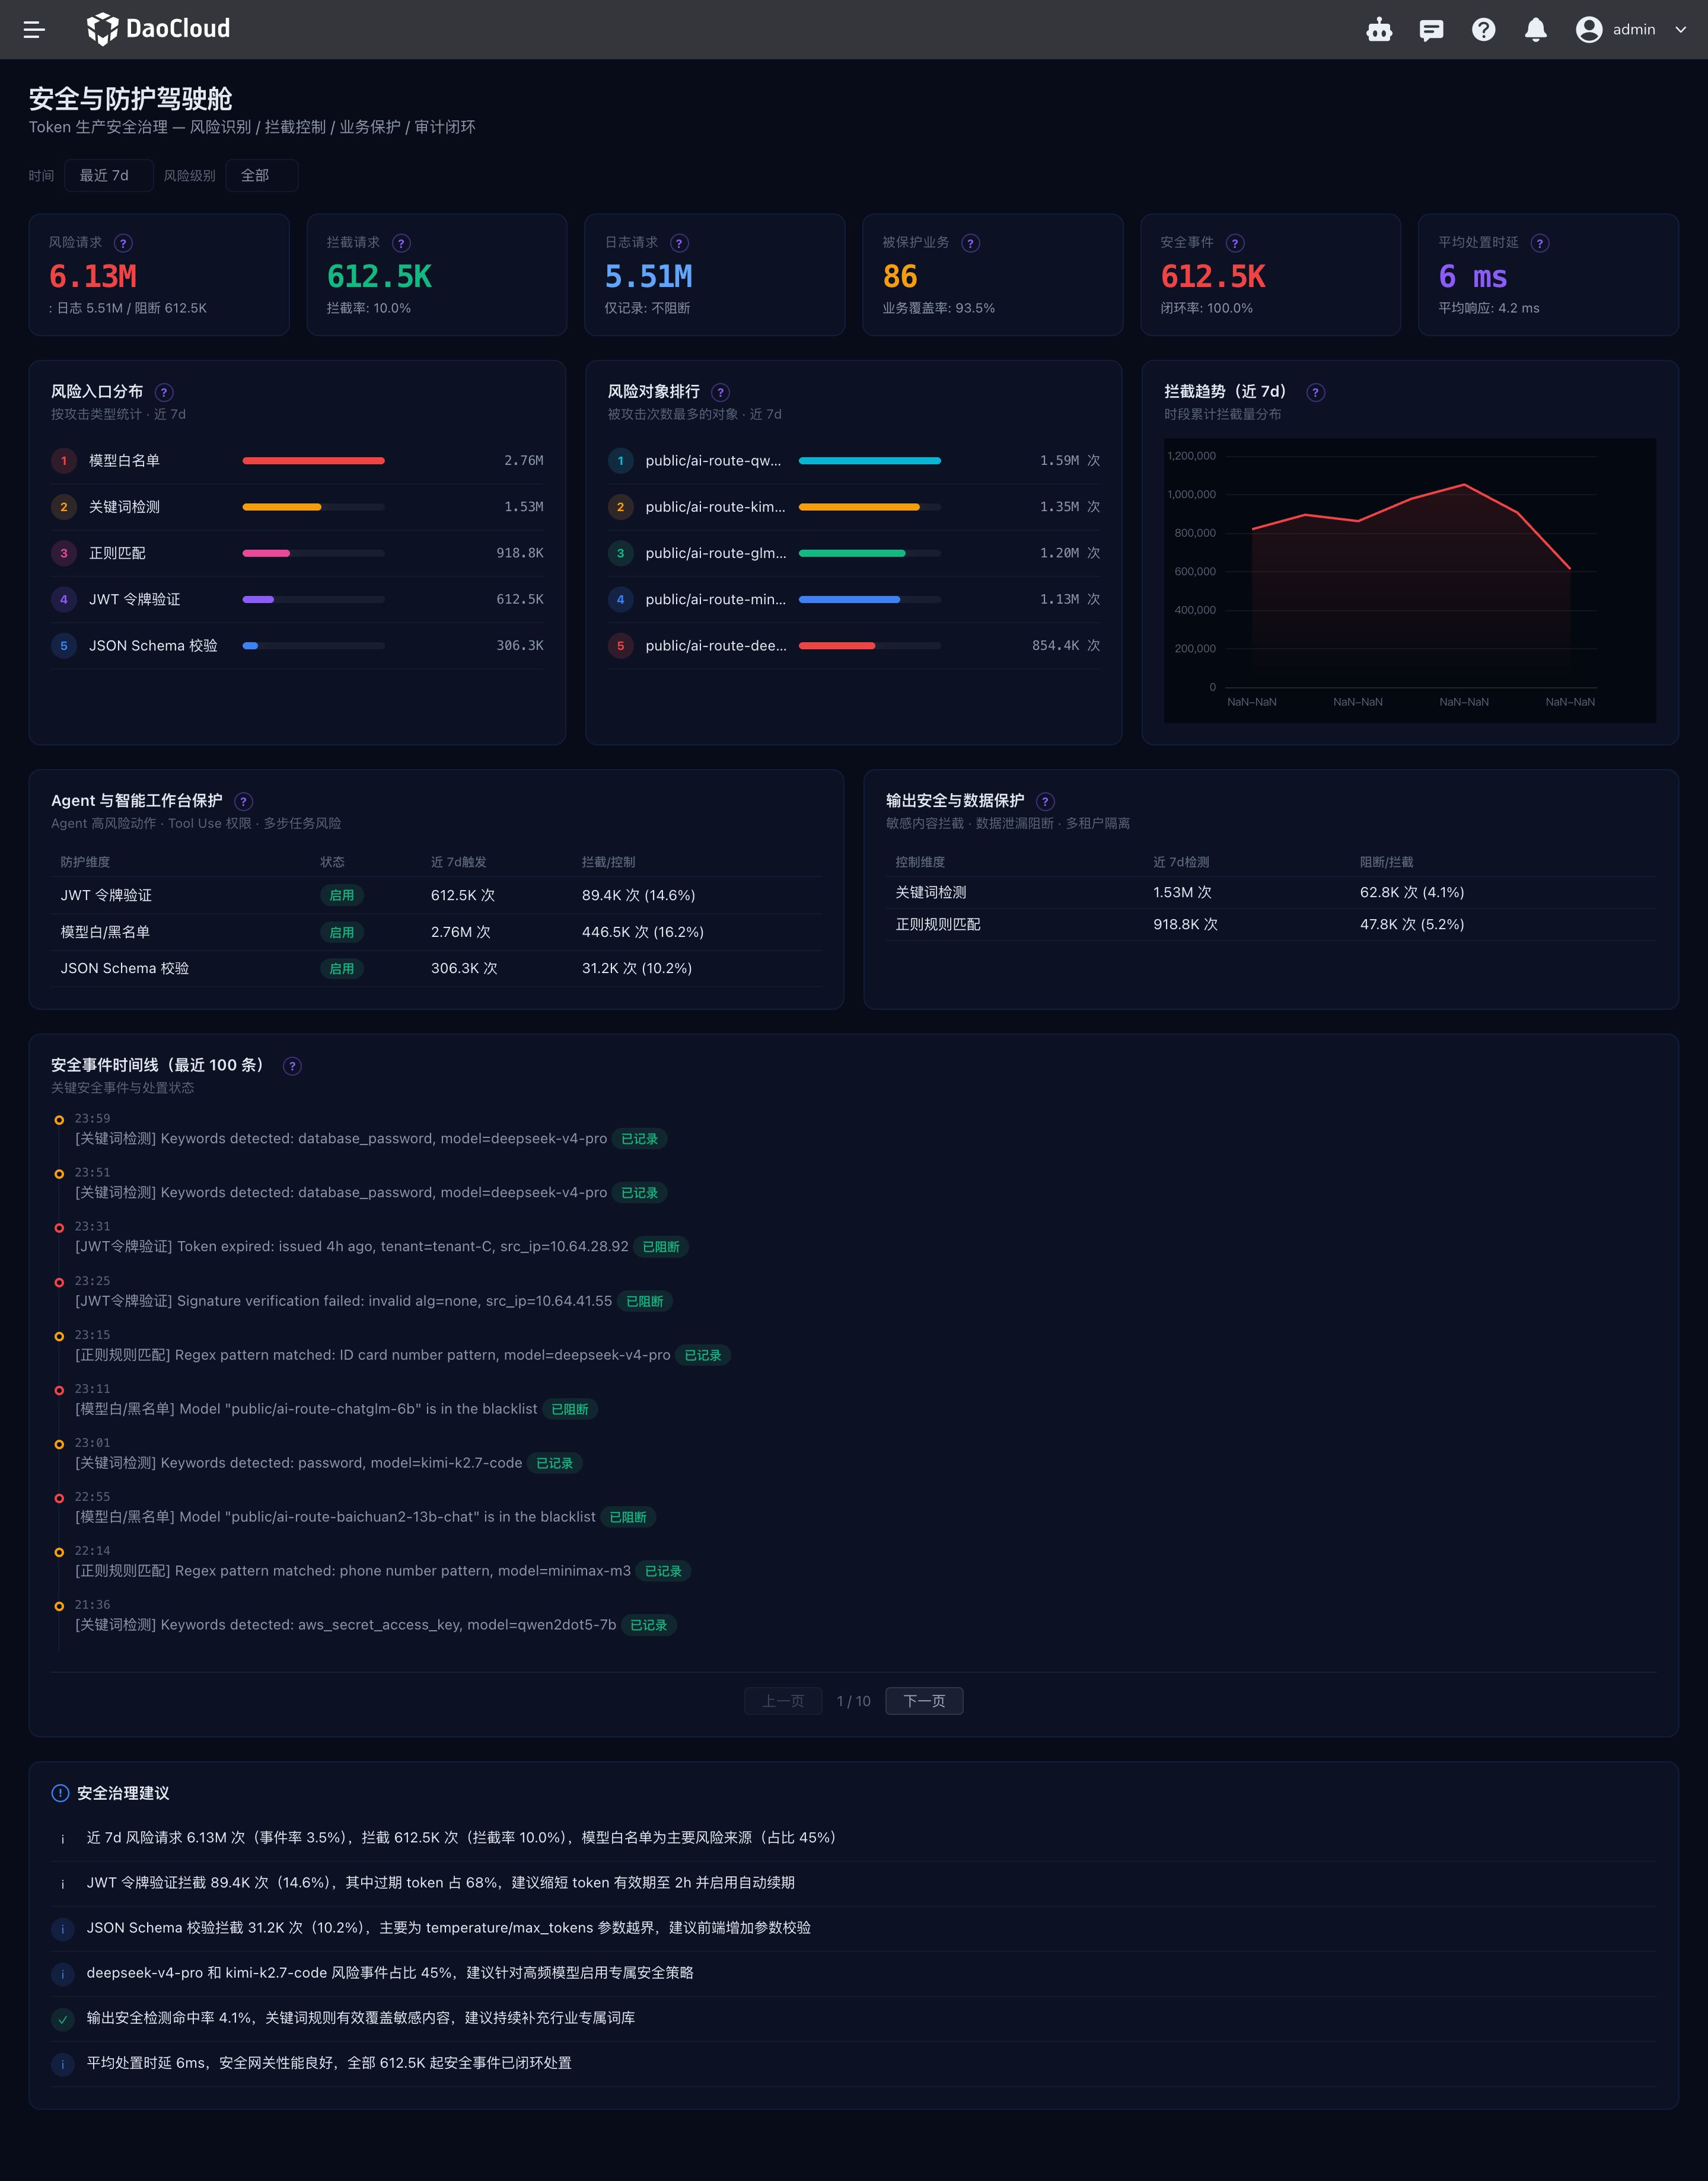
The Security Protection page is intended for security operations staff. It summarizes security risk identification, request blocking, protection policy status, and security events for token services, helping you track changes in risk and follow up on remediation.
How to Open
- Log in to the Token Factory console.
- In the product navigation, open Cockpit and select Security Protection.
Whether the menu is displayed depends on whether the user has permission to view the Security Protection page. If the menu is not visible, contact the administrator to check the Cockpit permissions.
Filtering Data
By default, the page shows data from the last 7 days. You can select the last 24 hours, 7 days, or 30 days, and filter by risk level: high, medium, or low. Select All to view all levels. After you change a filter, the panels on the page re-query data for the corresponding time range and risk level.
The security event timeline supports pagination, showing 10 events per page in reverse chronological order. After you change the filter conditions, the timeline returns to the first page.
Page Metrics
| Area | Description |
|---|---|
| Security metrics | Shows the number of risky requests, blocked requests, requests that only record audit logs, cluster coverage of enabled protection policies, the number of security events, and the average remediation latency. |
| Risk entry distribution | Counts risky requests within the selected range by attack or risk type. |
| Risk object ranking | Ranks the models or business objects that received the most risky requests. |
| Blocking trends | Shows how security policies block risky requests over the selected time range. When the last 24 hours are selected, data is shown by hour; for longer periods, the cumulative distribution over time buckets is shown. |
| Agent and workbench protection | Shows the status, trigger count, and blocking or control of protection dimensions such as high-risk agent actions, tool invocation permissions, and multi-step tasks. |
| Output security and data protection | Shows detection and blocking for control dimensions such as model output security, sensitive data protection, and tenant isolation. |
| Security event timeline | Shows the event time, risk level, event description, and remediation status, and lets you browse records page by page. |
| Security governance recommendations | Shows governance recommendations generated from security data. |
The time range and risk level filters at the top of the page apply to all statistical panels and the event list. The protected business metric shows the cluster coverage of clusters with at least one security protection policy enabled; click the description next to the metric to view its statistical definition.
Data Status Notes
Each panel loads and reports errors independently, so when a single panel fails, the other successfully loaded data remains available. When there are no events or risk records that match the filters, the ranking, trends, or timeline may be empty. If multiple panels consistently show no data, check whether the upstream security protection policies and Hydra security event data are connected.