Business Overview Panel
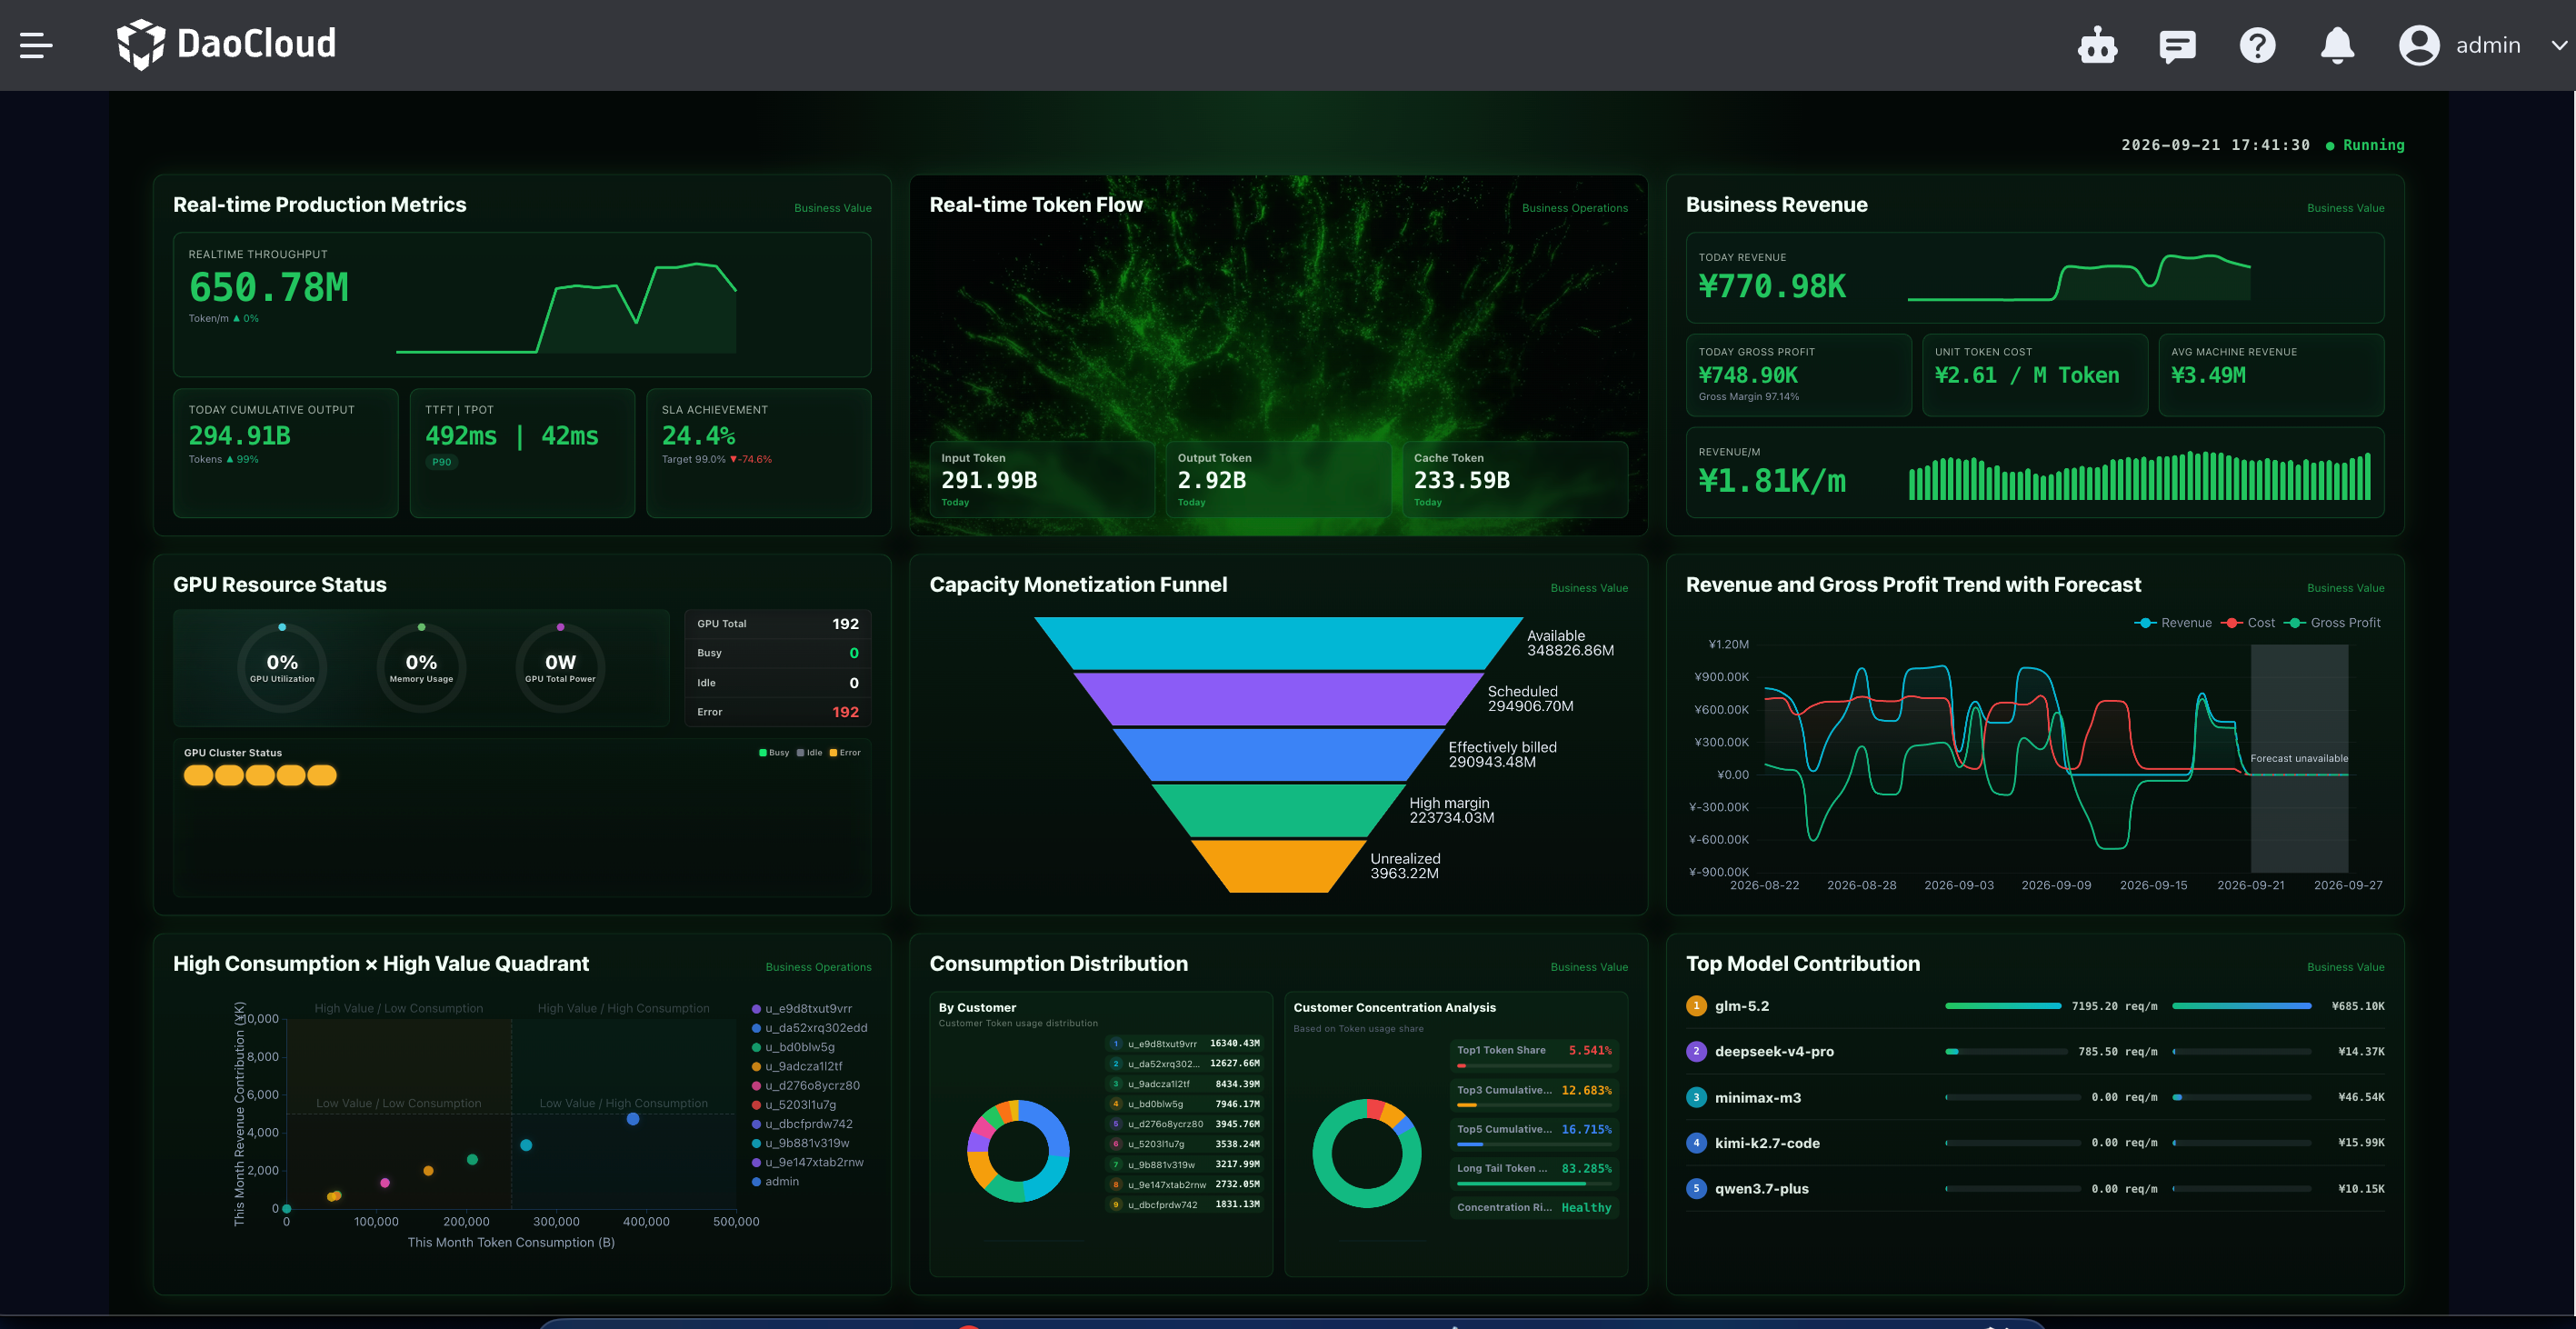
The Business Overview Panel is the default entry point of Cockpit. It presents the full picture of token production and business operations in a fixed 3x3 grid.
The top-right corner of the header shows the local time and the "Running" status. Business data refreshes approximately once per minute by default.
How to Open
- Go to the Token Factory console.
- In the product navigation, click Cockpit.
- Select Business Overview (the default entry point).
Page Description
| Area | Description |
|---|---|
| Header | Local time and "Running" status |
| 3x3 grid | Modules such as real-time production, traffic, business/organization, GPU, structure, and model contribution |
| Panel status | Shows "Loading" on the first load; shows "System exception" when a request fails, without displaying stale error details |
A failure in a single module does not block the other modules from rendering.
3x3 Grid Modules
| Module | What to look at |
|---|---|
| Real-time production metrics | Real-time throughput, cumulative output today, and token latency (P90); the fourth card is the SLA compliance rate (the percentage-point gap from the target) |
| Real-time token flow | Platform token traffic and its period-over-period change |
| Business revenue | Revenue, cost, and gross profit today, plus the unit token cost (/ M Token) |
| GPU resource status | GPU pool operating status and abnormal resources |
| Capacity monetization funnel | The conversion process from capacity to billable tokens |
| Revenue and gross profit trends and forecast | Historical revenue/gross profit trends and forecasts |
| High-consumption × high-value quadrant analysis | Quadrant distribution of tenant token consumption and revenue contribution |
| Consumption distribution | Usage distribution by customer, plus customer concentration risk grading |
| Top model contribution | Contribution ranking by model |
| Module | What to look at |
|---|---|
| Real-time production metrics | Real-time throughput, cumulative output today, and token latency (P90); the fourth card is the real-time request count (req/m) |
| Real-time token flow | Platform token traffic and its period-over-period change |
| Business overview for the current period | Monthly active user coverage, request volume comparison, cost allocation, and the 7-day user trend |
| GPU resource status | GPU pool operating status and abnormal resources |
| Department quotas and consumption | Organization monthly quota, consumption this month, and remaining quota; a limited quota utilization rate ≥ 80% is counted as a warning |
| Usage and capacity trends | Input/output tokens and GPU utilization over the last 30 days, with a 7-day forecast dashed line |
| High-consumption × high-value quadrant analysis | Quadrant distribution of department token consumption and active users |
| Organization usage distribution | Usage distribution by department, plus department concentration risk grading |
| Top model contribution | Contribution ranking by model |
Reading Suggestions
- Business review in operations mode: combine business revenue, the capacity monetization funnel, revenue and gross profit trends, and customer concentration to assess revenue quality and customer structure risk.
- Organizational governance in enterprise mode: combine the business overview for the current period, department quotas, and organization usage distribution to identify departments over quota and low-efficiency quadrants.
FAQ
Why do some modules show no data?
Cockpit is a read-side aggregated view that depends on upstream data such as usage, bills, and GPU metrics. If no data is available for the corresponding cluster or billing period, a module displays "No data" or stays in a failed-loading state. You can first check whether model services are generating invocations, and whether the billing and observability pipelines are working properly.