What is Insight
Insight is a next-generation, cloud native observability platform that focuses on application analysis. Its out-of-the-box real-time resource monitoring, metrics, logs, events, and other data assist enterprises in analyzing application status. Furthermore, it is compatible with popular open-source components, providing alerting, multi-dimensional data visualization, fault locating, and one-click monitoring and diagnosis.
Insight implements unified collection of metrics, logs, and traces, supports multi-dimensional alerting on metrics and logs, and provides a concise and clear visual management interface.
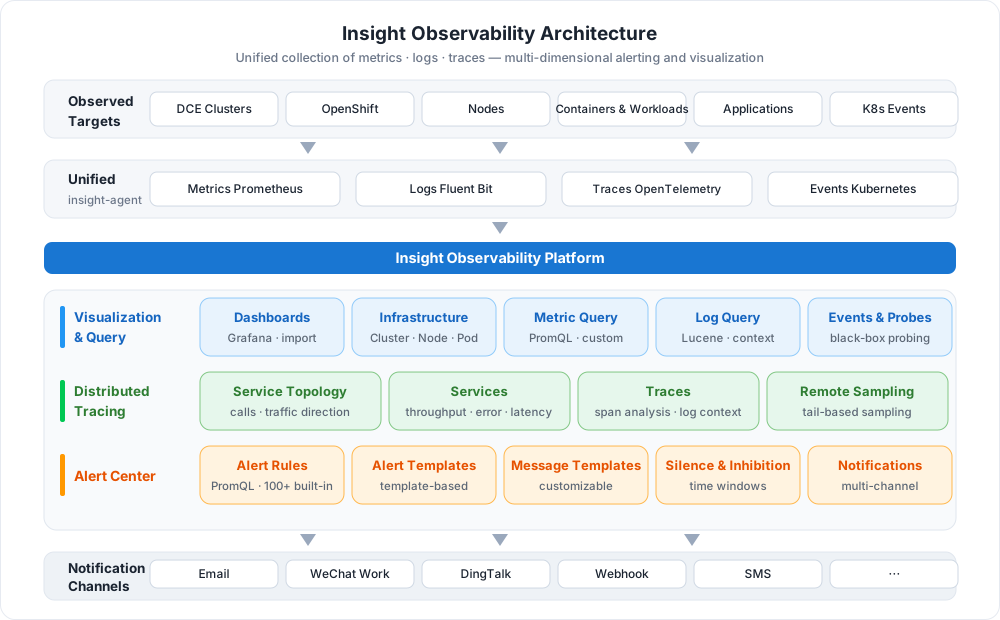
Key Capabilities
-
Dashboards
Built-in dashboards based on native Grafana covering platform components, cluster resources, and core components, with support for importing custom templates.
-
Infrastructure Monitoring
Centralized multi-cluster observability across clusters, nodes, namespaces, and containers, with event query and black-box probing.
-
Metric & Log Query
Metrics support basic and advanced PromQL queries; logs support keyword search, Lucene syntax, context viewing, and download.
-
Distributed Tracing
Traces are collected through OpenTelemetry, providing service topology, service lists, and trace analysis for rapid fault locating.
-
Alert Center
Over 100 built-in alert rules, custom PromQL rules, message templates, silence and inhibition, with notifications via email, WeChat Work, DingTalk, and more.
-
Collection & System Config
Manage insight-agent and metric/log collection tasks, and customize the retention duration of metrics, logs, and traces.
 View dashboards
Workflow
Using Insight usually involves two stages: deployment and integration followed by observation and alerting. Administrators plan resources and install insight-agent; business users then integrate application observability, view dashboards and query data, and configure alerts to detect anomalies in time.
flowchart LR
    A["① Resource planning<br/>Insight · insight-agent"] --> B["② Install insight-agent<br/>Online · offline"]
    B --> C["③ Integrate observability<br/>OpenTelemetry"]
    C --> D["④ Dashboards & queries<br/>Dashboards · metrics · logs"]
    D --> E["⑤ Configure alerts<br/>Rules · notifications"]

    click A href "../quickstart/res-plan/"
    click B href "../quickstart/install/install-agent/"
    click C href "../quickstart/otel/otel/"
    click D href "../user-guide/dashboard/dashboard/"
click E href "../user-guide/alert-center/alert-policy/"| Step | Role | Description |
|---|---|---|
| ① Resource planning | Platform Administrator | Evaluate the node and storage resources required by Insight and insight-agent |
| ② Install insight-agent | Platform Administrator | Install the collection components online or offline on observed clusters, and upgrade as needed |
| ③ Integrate observability | Business User | Collect traces and metrics through OpenTelemetry (non-intrusive Operator or SDK) |
| ④ Dashboards & queries | Business User | Understand application and cluster status through dashboards, metric and log queries |
| ⑤ Configure alerts | Platform Administrator | Create alert rules and notification configs to detect anomalies in time |
Quick Start
Basic concepts
The basic concepts related to observability (Insight) are as follows.
| # | Terms | Definitions |
|---|---|---|
| 1 | Target | The monitored object; the system will regularly initiate capture tasks to the monitoring point to obtain metrics |
| 2 | Metric | Use the open-metric format description to measure the degree of a certain attribute in a software or hardware system |
| 3 | Recording Rule | A named PromQL expression, which is a new metric obtained by calculating multiple metrics to describe a more complete and complex system state |
| 4 | Dashboard | Dashboard is a form of visual management, that is, the performance of data, intelligence and other conditions at a glance. It displays information through various visual perceptions with intuitive images and appropriate colors. Display the real-time situation of the platform and all performance metrics in DCE through visual graphics. |
| 6 | Service Discovery | A service discovery configuration for Kubernetes environment, used to batch and automatically access monitoring points on Kubernetes |
| 7 | Exporter | A service that can provide metrics, often understood as a monitoring object |
| 8 | Rule | A PromQL expression whose return value is a Boolean value, which describes whether the metric or custom metric is within the threshold range, and if not, an alert event will be generated |
| 9 | Alert | The record information when the alert rule is triggered, which records the alert rule, trigger time, and current system status; at the same time, it will trigger the corresponding action, such as sending an email |
| 10 | Notification | The alert event information sent by the system to the user through e-mail or other channels |
| 11 | PromQL | Query statements supported by the Prometheus system |
More Resources
-
Feature List
A complete list of Insight features across dashboards, infrastructure, metrics and logs, tracing, and the alert center.
-
Use Cases
Learn about unified multi-cluster data collection and observability, rapid fault locating and troubleshooting, and other typical use cases.
-
Benefits
Learn about the advantages of Insight in unified collection, out-of-the-box experience, and ecosystem compatibility.
-
Permissions
Learn about the user roles and permissions required for each Insight feature.
Download Center Learn about d.run Token Factory Learn about d.run AI OS View the Insight User Manual (PDF)