通过 Operator 实现应用程序无侵入增强
目前只有 Java、NodeJs、Python、.Net、Golang 支持 Operator 的方式无侵入接入。
前提条件
请确保 insight-agent 已经就绪。如若没有,请参考安装 insight-agent 采集数据并确保以下三项就绪:
- 为 insight-agent 开启 trace 功能
- trace 数据的地址以及端口是否填写正确
- deployment/insight-agent-opentelemetry-operator 和 deployment/insight-agent-opentelemetry-collector 对应的 Pod 已经准备就绪
安装 Instrumentation CR
Tip
从 Insight v0.22.0 开始,不再需要手动安装 Instrumentation CR。
在 insight-system 命名空间下安装,不同版本之间有一些细小的差别。
K8S_CLUSTER_UID=$(kubectl get namespace kube-system -o jsonpath='{.metadata.uid}')
kubectl apply -f - <<EOF
apiVersion: opentelemetry.io/v1alpha1
kind: Instrumentation
metadata:
  name: insight-opentelemetry-autoinstrumentation
  namespace: insight-system
spec:
  # https://github.com/open-telemetry/opentelemetry-operator/blob/main/docs/api.md#instrumentationspecresource
  resource:
    addK8sUIDAttributes: true
  env:
    - name: OTEL_EXPORTER_OTLP_ENDPOINT
      value: http://insight-agent-opentelemetry-collector.insight-system.svc.cluster.local:4317
  sampler:
    # Enum: always_on, always_off, traceidratio, parentbased_always_on, parentbased_always_off, parentbased_traceidratio, jaeger_remote, xray
    type: always_on
  java:
    image: ghcr.m.daocloud.io/openinsight-proj/autoinstrumentation-java:1.31.0
    env:
      - name: OTEL_JAVAAGENT_DEBUG
        value: "false"
      - name: OTEL_INSTRUMENTATION_JDBC_ENABLED
        value: "true"
      - name: SPLUNK_PROFILER_ENABLED
        value: "false"
      - name: OTEL_METRICS_EXPORTER
        value: "prometheus"
      - name: OTEL_METRICS_EXPORTER_PORT
        value: "9464"
      - name: OTEL_K8S_CLUSTER_UID
        value: $K8S_CLUSTER_UID
  nodejs:
    image: ghcr.m.daocloud.io/open-telemetry/opentelemetry-operator/autoinstrumentation-nodejs:0.41.1
  python:
    image: ghcr.m.daocloud.io/open-telemetry/opentelemetry-operator/autoinstrumentation-python:0.40b0
  dotnet:
    image: ghcr.m.daocloud.io/open-telemetry/opentelemetry-operator/autoinstrumentation-dotnet:1.0.0
  go:
    # Must set the default value manually for now.
    # See https://github.com/open-telemetry/opentelemetry-operator/issues/1756 for details.
    image: ghcr.m.daocloud.io/open-telemetry/opentelemetry-go-instrumentation/autoinstrumentation-go:v0.2.2-alpha
EOF
kubectl apply -f - <<EOF
apiVersion: opentelemetry.io/v1alpha1
kind: Instrumentation
metadata:
  name: insight-opentelemetry-autoinstrumentation
  namespace: insight-system
spec:
  # https://github.com/open-telemetry/opentelemetry-operator/blob/main/docs/api.md#instrumentationspecresource
  resource:
    addK8sUIDAttributes: true
  env:
    - name: OTEL_EXPORTER_OTLP_ENDPOINT
      value: http://insight-agent-opentelemetry-collector.insight-system.svc.cluster.local:4317
  sampler:
    # Enum: always_on, always_off, traceidratio, parentbased_always_on, parentbased_always_off, parentbased_traceidratio, jaeger_remote, xray
    type: always_on
  java:
    image: ghcr.m.daocloud.io/open-telemetry/opentelemetry-operator/autoinstrumentation-java:1.29.0
    env:
      - name: OTEL_JAVAAGENT_DEBUG
        value: "false"
      - name: OTEL_INSTRUMENTATION_JDBC_ENABLED
        value: "true"
      - name: SPLUNK_PROFILER_ENABLED
        value: "false"
      - name: OTEL_METRICS_EXPORTER
        value: "prometheus"
      - name: OTEL_METRICS_EXPORTER_PORT
        value: "9464"
  nodejs:
    image: ghcr.m.daocloud.io/open-telemetry/opentelemetry-operator/autoinstrumentation-nodejs:0.41.1
  python:
    image: ghcr.m.daocloud.io/open-telemetry/opentelemetry-operator/autoinstrumentation-python:0.40b0
  dotnet:
    image: ghcr.m.daocloud.io/open-telemetry/opentelemetry-operator/autoinstrumentation-dotnet:1.0.0-rc.2
  go:
    # Must set the default value manually for now.
    # See https://github.com/open-telemetry/opentelemetry-operator/issues/1756 for details.
    image: ghcr.m.daocloud.io/open-telemetry/opentelemetry-go-instrumentation/autoinstrumentation-go:v0.2.2-alpha
EOF
kubectl apply -f - <<EOF
apiVersion: opentelemetry.io/v1alpha1
kind: Instrumentation
metadata:
  name: insight-opentelemetry-autoinstrumentation
  namespace: insight-system
spec:
  # https://github.com/open-telemetry/opentelemetry-operator/blob/main/docs/api.md#instrumentationspecresource
  resource:
    addK8sUIDAttributes: true
  env:
    - name: OTEL_EXPORTER_OTLP_ENDPOINT
      value: http://insight-agent-opentelemetry-collector.insight-system.svc.cluster.local:4317
  sampler:
    # Enum: always_on, always_off, traceidratio, parentbased_always_on, parentbased_always_off, parentbased_traceidratio, jaeger_remote, xray
    type: always_on
  java:
    image: ghcr.m.daocloud.io/open-telemetry/opentelemetry-operator/autoinstrumentation-java:1.25.0
    env:
      - name: OTEL_JAVAAGENT_DEBUG
        value: "false"
      - name: OTEL_INSTRUMENTATION_JDBC_ENABLED
        value: "true"
      - name: SPLUNK_PROFILER_ENABLED
        value: "false"
      - name: OTEL_METRICS_EXPORTER
        value: "prometheus"
      - name: OTEL_METRICS_EXPORTER_PORT
        value: "9464"
  nodejs:
    image: ghcr.m.daocloud.io/open-telemetry/opentelemetry-operator/autoinstrumentation-nodejs:0.37.0
  python:
    image: ghcr.m.daocloud.io/open-telemetry/opentelemetry-operator/autoinstrumentation-python:0.38b0
  go:
    # Must set the default value manually for now.
    # See https://github.com/open-telemetry/opentelemetry-operator/issues/1756 for details.
    image: ghcr.m.daocloud.io/open-telemetry/opentelemetry-go-instrumentation/autoinstrumentation-go:v0.2.1-alpha
EOF
kubectl apply -f - <<EOF
apiVersion: opentelemetry.io/v1alpha1
kind: Instrumentation
metadata:
  name: insight-opentelemetry-autoinstrumentation
  namespace: insight-system
spec:
  # https://github.com/open-telemetry/opentelemetry-operator/blob/main/docs/api.md#instrumentationspecresource
  resource:
    addK8sUIDAttributes: true
  env:
    - name: OTEL_EXPORTER_OTLP_ENDPOINT
      value: http://insight-agent-opentelemetry-collector.insight-system.svc.cluster.local:4317
  sampler:
    # Enum: always_on, always_off, traceidratio, parentbased_always_on, parentbased_always_off, parentbased_traceidratio, jaeger_remote, xray
    type: always_on
  java:
    image: ghcr.m.daocloud.io/open-telemetry/opentelemetry-operator/autoinstrumentation-java:1.23.0
    env:
      - name: OTEL_JAVAAGENT_DEBUG
        value: "false"
      - name: OTEL_INSTRUMENTATION_JDBC_ENABLED
        value: "true"
      - name: SPLUNK_PROFILER_ENABLED
        value: "false"
      - name: OTEL_METRICS_EXPORTER
        value: "prometheus"
      - name: OTEL_METRICS_EXPORTER_PORT
        value: "9464"
  nodejs:
    image: ghcr.m.daocloud.io/open-telemetry/opentelemetry-operator/autoinstrumentation-nodejs:0.34.0
  python:
    image: ghcr.m.daocloud.io/open-telemetry/opentelemetry-operator/autoinstrumentation-python:0.33b0
EOF
与服务网格链路串联场景
如果您开启了服务网格的链路追踪能力,需要额外增加一个环境变量注入的配置:
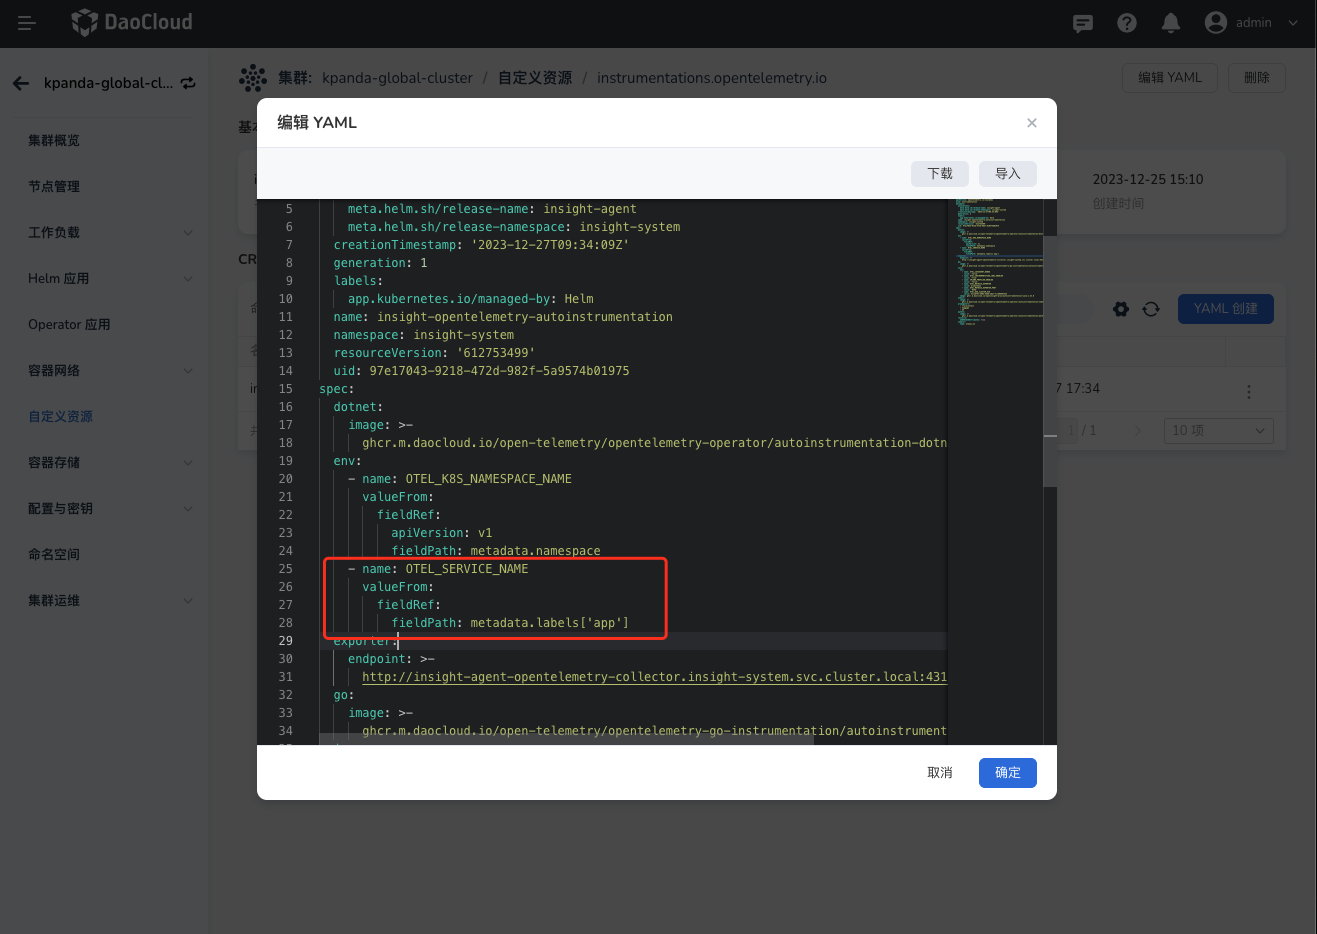
操作步骤如下
- 登录 DCE 5.0,进入 容器管理 后选择进入目标集群,
- 点击左侧导航栏选择 自定义资源 ,找到 instrumentations.opentelemetry.io 后进入详情页。
-
选择 insight-system 命名空间后,编辑 insight-opentelemetry-autoinstrumentation ,在 spec:env: 下添加以下内容:
完整的命令如下(For Insight v0.21.x):
K8S_CLUSTER_UID=$(kubectl get namespace kube-system -o jsonpath='{.metadata.uid}')
kubectl apply -f - <<EOF
apiVersion: opentelemetry.io/v1alpha1
kind: Instrumentation
metadata:
  name: insight-opentelemetry-autoinstrumentation
  namespace: insight-system
spec:
  # https://github.com/open-telemetry/opentelemetry-operator/blob/main/docs/api.md#instrumentationspecresource
  resource:
    addK8sUIDAttributes: true
  env:
    - name: OTEL_EXPORTER_OTLP_ENDPOINT
      value: http://insight-agent-opentelemetry-collector.insight-system.svc.cluster.local:4317
    - name: OTEL_SERVICE_NAME
      valueFrom:
        fieldRef:
          fieldPath: metadata.labels['app']
  sampler:
    # Enum: always_on, always_off, traceidratio, parentbased_always_on, parentbased_always_off, parentbased_traceidratio, jaeger_remote, xray
    type: always_on
  java:
    image: ghcr.m.daocloud.io/openinsight-proj/autoinstrumentation-java:1.31.0
    env:
      - name: OTEL_JAVAAGENT_DEBUG
        value: "false"
      - name: OTEL_INSTRUMENTATION_JDBC_ENABLED
        value: "true"
      - name: SPLUNK_PROFILER_ENABLED
        value: "false"
      - name: OTEL_METRICS_EXPORTER
        value: "prometheus"
      - name: OTEL_METRICS_EXPORTER_PORT
        value: "9464"
      - name: OTEL_K8S_CLUSTER_UID
        value: $K8S_CLUSTER_UID
  nodejs:
    image: ghcr.m.daocloud.io/open-telemetry/opentelemetry-operator/autoinstrumentation-nodejs:0.41.1
  python:
    image: ghcr.m.daocloud.io/open-telemetry/opentelemetry-operator/autoinstrumentation-python:0.40b0
  dotnet:
    image: ghcr.m.daocloud.io/open-telemetry/opentelemetry-operator/autoinstrumentation-dotnet:1.0.0
  go:
    # Must set the default value manually for now.
    # See https://github.com/open-telemetry/opentelemetry-operator/issues/1756 for details.
    image: ghcr.m.daocloud.io/open-telemetry/opentelemetry-go-instrumentation/autoinstrumentation-go:v0.2.2-alpha
EOF
添加注解,自动接入链路
以上就绪之后,您就可以通过注解(Annotation)方式为应用程序接入链路追踪了,OTel 目前支持通过注解的方式接入链路。 根据服务语言,需要添加上不同的 pod annotations。每个服务可添加两类注解之一:
-
只注入环境变量注解
这类注解只有一个,用于添加 otel 相关的环境变量,比如链路上报地址、容器所在的集群 id、命名空间等(这个注解在应用不支持自动探针语言时十分有用)
instrumentation.opentelemetry.io/inject-sdk: "insight-system/insight-opentelemetry-autoinstrumentation"其中 value 被
/分成两部分,第一个值 (insight-system) 是上一步安装的 CR 的命名空间, 第二个值 (insight-opentelemetry-autoinstrumentation) 是这个 CR 的名字。 -
自动探针注入以及环境变量注入注解
这类注解目前有 4 个,分别对应 4 种不同的编程语言:java、nodejs、python、dotnet, 使用它后就会对 spec.pod 下的第一个容器注入自动探针以及 otel 默认环境变量:
由于 Go 自动检测需要设置 OTEL_GO_AUTO_TARGET_EXE, 因此您必须通过注解或 Instrumentation 资源提供有效的可执行路径。未设置此值会导致 Go 自动检测注入中止,从而导致接入链路失败。
instrumentation.opentelemetry.io/inject-go: "insight-system/insight-opentelemetry-autoinstrumentation"
instrumentation.opentelemetry.io/otel-go-auto-target-exe: "/path/to/container/executable"
Go 自动检测也需要提升权限。以下权限是自动设置的并且是必需的。
Tip
OpenTelemetry Operator 在注入探针时会自动添加一些 OTel 相关环境变量,同时也支持这些环境变量的覆盖。这些环境变量的覆盖优先级:
original container env vars -> language specific env vars -> common env vars -> instrument spec configs' vars
但是需要避免手动覆盖 OTEL_RESOURCE_ATTRIBUTES_NODE_NAME,它在 Operator 内部作为一个 Pod 是否已经注入探针的标识,如果手动添加了,探针可能无法注入。
自动注入示例 Demo
注意这个 annotations 是加在 spec.annotations 下的。
apiVersion: apps/v1
kind: Deployment
metadata:
  name: my-app
  labels:
    app: my-app
spec:
  selector:
    matchLabels:
      app: my-app
  replicas: 1
  template:
    metadata:
      labels:
        app: my-app
      annotations:
        instrumentation.opentelemetry.io/inject-java: "insight-system/insight-opentelemetry-autoinstrumentation"
    spec:
      containers:
      - name: myapp
        image: ghcr.io/pavolloffay/spring-petclinic:latest
        ports:
          - containerPort: 8080
            protocol: TCP
在原本编排基础上最终合并生成的 YAML 内容如下:
apiVersion: v1
kind: Pod
metadata:
  name: my-deployment-with-sidecar-565bd877dd-nqkk6
  generateName: my-deployment-with-sidecar-565bd877dd-
  namespace: default
  uid: aa89ca0d-620c-4d20-8bc1-37d67bad4ea4
  resourceVersion: '2668986'
  creationTimestamp: '2022-04-08T05:58:48Z'
  labels:
    app: my-app
  annotations:
    instrumentation.opentelemetry.io/inject-java: "insight-system/insight-opentelemetry-autoinstrumentation"
spec:
  volumes:
    - name: kube-api-access-sp2mz
      projected:
        sources:
          - serviceAccountToken:
              expirationSeconds: 3607
              path: token
          - configMap:
              name: kube-root-ca.crt
              items:
                - key: ca.crt
                  path: ca.crt
          - downwardAPI:
              items:
                - path: namespace
                  fieldRef:
                    apiVersion: v1
                    fieldPath: metadata.namespace
        defaultMode: 420
+   - name: opentelemetry-auto-instrumentation-java
+     emptyDir:
+       sizeLimit: 200Mi
+ initContainers:
+   - name: opentelemetry-auto-instrumentation-java
+     image: ghcr.m.daocloud.io/openinsight-proj/autoinstrumentation-java:1.45.0-eb49d21116a1d8fbf0d9080adddad3a367e68a5e
+     imagePullPolicy: IfNotPresent
+     command:
+       - cp
+       - /javaagent.jar
+       - /otel-auto-instrumentation-java/javaagent.jar
+     resources:
+       limits:
+         cpu: 500m
+         memory: 64Mi
+       requests:
+         cpu: 50m
+         memory: 64Mi
+     terminationMessagePath: /dev/termination-log
+     terminationMessagePolicy: File
+     volumeMounts:
+       - name: opentelemetry-auto-instrumentation-java
+         mountPath: /otel-auto-instrumentation-java
+       - name: kube-api-access-sp2mz
+         readOnly: true
+         mountPath: /var/run/secrets/kubernetes.io/serviceaccount
  containers:
    - name: myapp
      image: ghcr.io/pavolloffay/spring-petclinic:latest
      imagePullPolicy: Always
      ports:
        - containerPort: 8080
          protocol: TCP
+     env:
+       - name: OTEL_JAVAAGENT_DEBUG
+         value: "false"
+       - name: OTEL_INSTRUMENTATION_JDBC_ENABLED
+         value: "true"
+       - name: SPLUNK_PROFILER_ENABLED
+         value: "false"
+       - name: JAVA_TOOL_OPTIONS
+         value: ' -javaagent:/otel-auto-instrumentation-java/javaagent.jar'
+       - name: OTEL_EXPORTER_OTLP_ENDPOINT
+         value: http://insight-agent-opentelemetry-collector.insight-system.svc.cluster.local:4317
+       - name: OTEL_NODE_IP
+         valueFrom:
+           fieldRef:
+             apiVersion: v1
+             fieldPath: status.hostIP
+       - name: OTEL_POD_IP
+         valueFrom:
+           fieldRef:
+             apiVersion: v1
+             fieldPath: status.podIP
+       - name: OTEL_K8S_CLUSTER_UID
+         value: 416d133f-d00a-43e1-b859-f1839a5a93ee
+       - name: OTEL_EXPORTER_OTLP_PROTOCOL
+         value: grpc
+       - name: OTEL_K8S_NAMESPACE_NAME
+         valueFrom:
+           fieldRef:
+             apiVersion: v1
+             fieldPath: metadata.namespace
+       - name: OTEL_LOGS_EXPORTER
+         value: none
+       - name: OTEL_METRICS_EXPORTER
+         value: prometheus
+       - name: OTEL_EXPORTER_PROMETHEUS_PORT
+         value: "9464"
+       - name: OTEL_SERVICE_NAME
+         value: my-app
+       - name: OTEL_RESOURCE_ATTRIBUTES_POD_NAME
+         valueFrom:
+           fieldRef:
+             apiVersion: v1
+             fieldPath: metadata.name
+       - name: OTEL_PROPAGATORS
+         value: tracecontext,baggage,b3,b3multi,jaeger,xray,ottrace
+       - name: OTEL_TRACES_SAMPLER
+         value: always_on
+       - name: OTEL_RESOURCE_ATTRIBUTES_POD_UID
+         valueFrom:
+           fieldRef:
+             apiVersion: v1
+             fieldPath: metadata.uid
+       - name: OTEL_RESOURCE_ATTRIBUTES_NODE_NAME
+         valueFrom:
+           fieldRef:
+             apiVersion: v1
+             fieldPath: spec.nodeName
+       - name: OTEL_RESOURCE_ATTRIBUTES
+         value: k8s.container.name=myapp,k8s.deployment.name=my-app,k8s.deployment.uid=25ce570c-8401-4f07-b8a9-dd64fcf3a1d1,k8s.namespace.name=default,k8s.node.name=$(OTEL_RESOURCE_ATTRIBUTES_NODE_NAME),k8s.pod.name=$(OTEL_RESOURCE_ATTRIBUTES_POD_NAME),k8s.pod.uid=$(OTEL_RESOURCE_ATTRIBUTES_POD_UID),k8s.replicaset.name=my-app-54fc75999c,k8s.replicaset.uid=56358d62-1321-4a62-b2e9-34132988efa0,service.instance.id=default.$(OTEL_RESOURCE_ATTRIBUTES_POD_NAME).myapp,service.version=latest
      resources: {}
      terminationMessagePath: /dev/termination-log
      terminationMessagePolicy: File
      volumeMounts:
        - name: kube-api-access-sp2mz
          readOnly: true
          mountPath: /var/run/secrets/kubernetes.io/serviceaccount
+       - name: opentelemetry-auto-instrumentation-java
+         mountPath: /otel-auto-instrumentation-java
🔔 需要注意的是,不同的版本自动注入后生成 YAML 并不完全一致。
链路查询
如何查询已经接入的服务,参考链路查询。
安装多个 Instrumentation CR 满足差异化配置
上面的自动注入 CR 属于 Insight 内置且通用的。实际场景中,为了满足差异化配置需求,可以安装多个 Instrumentation CR,每个 CR 名字不同,再按需引用不同 CR 名字。
典型适用场景如下:
- 环境隔离:开发/测试/生产环境需独立配置采样率、Exporter 端点等参数。
- 团队/业务线隔离:不同团队对遥测数据的存储位置、资源标签有独立需求。
- 服务类型差异化:前端、后端、数据处理服务的采样率、指标收集范围不同。
- 采样策略精细化:高频服务低采样,核心链路全采样,避免性能开销。
- 灰度发布与测试:通过新 CR 测试配置变更,验证后逐步替换旧配置。
- 命名空间隔离:不同命名空间的服务使用独立 CR,避免配置干扰。
- 合规性要求:欧盟服务需将数据发送至欧盟境内 Collector,符合 GDPR。
- 资源标签区分:为不同服务群体添加专属标签(如 team: a、env: prod)。
核心逻辑:通过多 CR 实现 “分而治之”,避免单一配置无法满足多维度需求。
例如:
-
再创建一个
insight-opentelemetry-autoinstrumentation-debugInstrumentation CR 用于项目组 B 调试新的 Java Agent 版本:apiVersion: opentelemetry.io/v1alpha1 kind: Instrumentation metadata: name: insight-opentelemetry-autoinstrumentation-debug # 👈 用于区分不同 Instrumentation CR namespace: insight-system spec: java: image: ghcr.m.daocloud.io/open-telemetry/opentelemetry-operator/autoinstrumentation-java:my-debug-xx.xx # 👈 用于测试的版本镜像 ······ env: - name: OTEL_JAVAAGENT_DEBUG value: "false" - name: OTEL_INSTRUMENTATION_JDBC_ENABLED value: "true" - name: SPLUNK_PROFILER_ENABLED value: "false" - name: OTEL_METRICS_EXPORTER value: "prometheus" - name: OTEL_METRICS_EXPORTER_PORT value: "9464" ······ -
更改原本服务使用的注解,使用
insight-system/insight-opentelemetry-autoinstrumentation-debug注解: